Tezos Price Prediction – July 11
The current northward-range trading shows the Tezos market appears, getting set for swing highs. Price has recorded an all-time high of $9.18 and a low of $0.3146. Currently, the price trades around 1.67 at a positive percentage rate of 3.33.
Tezos (XTZ) Market
Key Levels:
Resistance levels: $2, $2.25, $2.50
Support levels: $1.25, $1, $0.75
Tezos (XTZ) Statistics:
XTZ price now – $1.68
XTZ market cap – $1.5 billion
XTZ circulating supply – 901.2 million
XTZ total supply – 922.8 million
Coinmarketcap ranking – #35
XTZ/USD – Daily Chart
The XTZ/USD daily chart showcases the crypto economy appearing, getting set for swing highs around the trend line of the smaller SMA. The horizontal line drew at the $1.25 support level beneath the resistance value-line posted by the smaller-SMA trading indicator at around $1.57. The the50-day SMA trend line is above the 14-day SMA trend line. The Stochastic Oscillators in the overbought region move in a consolidation manner.
Will the XTZ increase in swinging highs as traded against the US Dollar?
The Tezos market operation may increase in swinging highs against the US Dollar in the following sessions. Indicators are showing the price appears, getting set for swing highs around the 14-day SMA trend line. However, the XTZ/USD market buyers are to exercise caution by avoiding opening a buying order when the market tends to result in a correction around the smaller SMA, possibly in no time.
On the downside of the technical analysis, an overbought reading condition in the market by the Stochastic Oscillators, the XTZ/USD market bears may have to be on the lookout for a price rejection between the values of $1.57 and $2.12 before exerting a declining force on the market. It requires little patience to allow sellers to regain control of the crypto economy.
XTZ/BTC Price Analysis
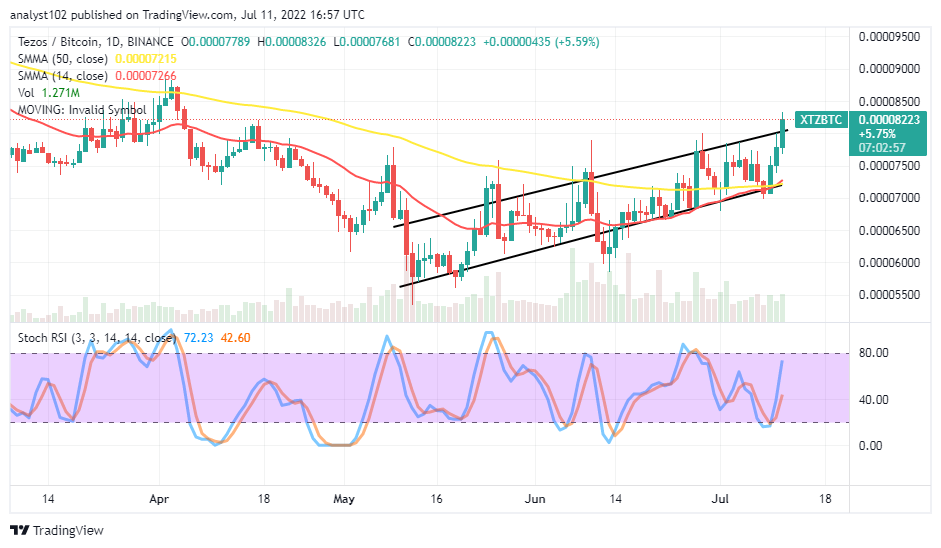
Texas’s trending capacity against Bitcoin has been in an increasing-moving mode. The duo cryptos have been running into swing highs. The 14-day SMA trend line has moved northward to touch the 50-day SMA from underneath. The lower bullish trend line draws northward alongside the trend line of the smaller SMA. A bullish candlestick has emerged against the upper trend line. The Stochastic Oscillators have crossed northbound from the 20 range, closely approaching the range of 80.

Our Recommended Crypto Exchange for U.S. customers
- 120+ Cryptos Wallet Available
- Paypal available
- Licensed and regulated in the U.S.
- Social trading Platform & copy trading
- Low trading fees
68% of retail investor accounts lose money when trading CFDs with this provider.
Read more:
Credit: Source link


