XRP Price Ranges – July 5
The market worth of Ripple XRP/USD’s price ranges around the value of $0.60 to trade at $0.65. The crypto’s percentage rate is estimated at -5.41 as of writing.
Price Ranges: XRP Market
Key Levels:
Resistance levels: $0.80, $1, $1.20
Support levels: $0.50, $0.40, $0.30
There have been variant smaller candlesticks that characterize the XRP/USD price ranges mainly around $0.60. The 50-day SMA indicator is between the values of $0.80 and $1 above the 14-day SMA trend-line as the bearish trend-line drew downward to join the smaller SMA in a backing-resistant manner. The Stochastic Oscillators are in the overbought region with conjoint lines, indicating that a consolidation movement is ongoing in the crypto economy presently.
When will there be an end to the current sideways as the XRP/USD price ranges?
From the technical view of analysis, two points of $0.60 and $0.80 involve in the present range-bound trading outlook of the XRP/USD. Being as it is, the crypto’s price tends to range more until several sessions especially, while both the two market-movers refuse to come with full force. However, the current level appears to be one of the best times for investment.
On the downside, the market level at $0.80 needed to be held by bears for re-launching their positions. A trading indicator suggests that the momentum to the upside is presently losing grand on a gradual term. As a result, if the downward force increases, the Ripple XRP’s valuation may revisit a lowly-previous point around the level of $0.50. And, in an extension of that, the support level of $0.40 could be the actual target. After, a quick rebounding movement may surface to suggest an end of the assumed downward force.
XRP/BTC Price Analysis
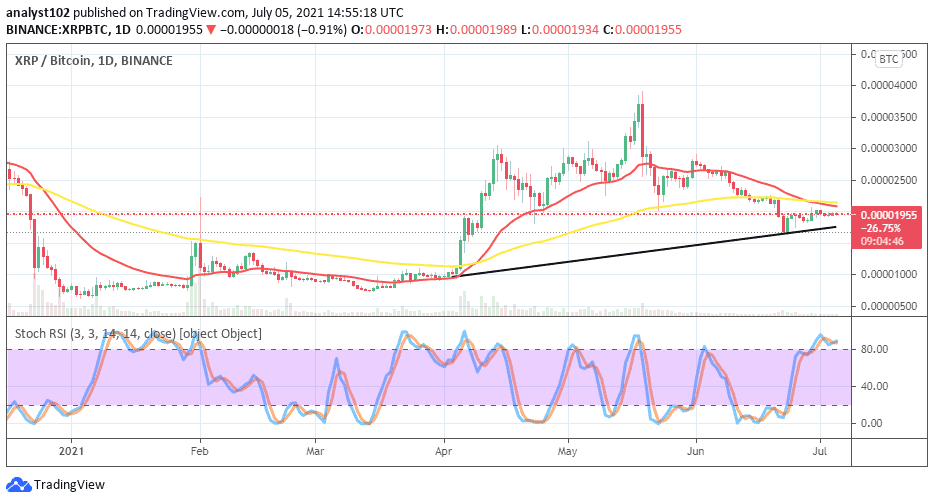
In comparison, the market valuation of Ripple XRP versus Bitcoin appears now that the base crypto’s price ranges pairing with the flagship counter instrument. The 50-day SMA indicator has briefly intercepted by the 14-day SMA trend-line to the south close over the current trending situation of the two cryptos. The bullish trend-line drew to nurse the belief that the base trading tool still has a weightier trending potential as paired with its counter instrument. The Stochastic Oscillators in the overbought region, trying to point northbound further to indicate that the base crypto possesses greater potency of trending than the counter crypto in the near time.
Looking to buy or trade XRP (XRP) now? Invest at eToro!
75% of retail investor accounts lose money when trading CFDs with this provider.
Credit: Source link


