XRP Market Hovers at $0.60 – July 27
The Ripple XRP/USD market hovers around the point at $0.60. A line of smaller-ups occurs in the crypto’s transaction to trade around the level of $0.62.at a positive percentage of 0.48.
Market Hovers at $0.60: XRP Market
Key Levels:
Resistance levels: $0.70, $0.90, $1.10
Support levels: $0.50, $0.40, $0.30
The XRP/USD daily chart reveals that the crypto market hovers around the line at $0.60.
The Stochastic Oscillators are in the overbought region with the two lines conjoined, suggesting that the market’s momentum to the upside is bound to lose out.
The 14-day SMA indicator is beneath the 50-day SMA indicator. And, they appear facing the east than any other direction to denote that a kind of price consolidation motion is ongoing in the crypto trade.
The bearish trend-line drew across the SMAs downward, touching the smaller SMA on the buy signal side.
Will the crypto economy break out as the market hovers at $0.60?
As the Ripple XRP/USD market hovers around the level of $0.60, the asset is finding it tougher to rise northwardly past the main.
In the meantime, the crypto market may downsize possibly, in a low-active motion to the lower support trading points around $0.50 or around the lower level at $0.40.
Being as it is, investors may go ahead joining the market now or even while the price still moves down.
On the downside of technical analysis, the market’s price around the point of $0.60 may in the near time witness a chain of lower lows.
In the process of that assumption to play out, bears needed to be wary of launching more shorting positions to avoid the probability of being whipsawed in no time.
Reason being that such moves are likely not going to carry much weighty force to the downside.

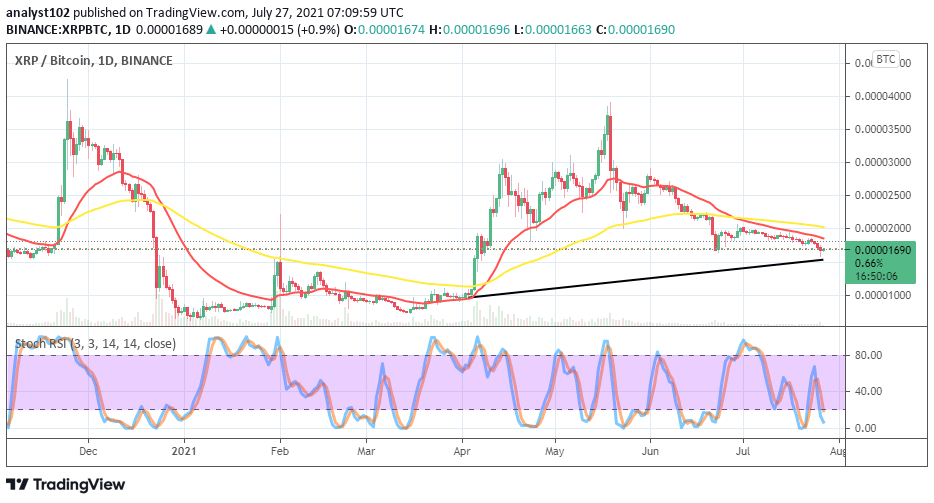
XRP/BTC Price Analysis
The trending catalyst that Bitcoin holds to counter the upward movement of Ripple XRP has caused the base crypto market to hover at a lower point beneath the trend lines of the SMAs. The 50-day SMA indicator is over the 14-day SMA indicator.
The bullish trend-line drew to showcase the possibility that the base crypto may in the near time trend against the flagship counter trading instrument.
The Stochastic Oscillators are in the oversold region, attempting to cross the lines to the northbound. That signifies that the base crypto may regain the lost momentum to the countercrypto tool in the next couple of sessions.
Looking to buy or trade XRP (XRP) now? Invest at eToro!
67% of retail investor accounts lose money when trading CFDs with this provider
Credit: Source link


