Join Our Telegram channel to stay up to date on breaking news coverage
Ripple’s price action has been generally oscillating within two key Fibonacci levels. Fib level 50 acted as the resistance while Fib level 61.80 acted as the support. Currently, the price is bouncing upwards after sitting comfortably at the price level of $0.4481.
XRP’s Analysis Statistics Data:
Ripple’s value now: $0.4760
XRP’s market cap: $24 billion
Ripple’s moving supply: 49.86 billion
Total supply of XRP: 99.99 billion
XRP’s Coinmarketcap ranking: #6
A closer examination will be given to price action in this market. This will be done with the anticipation of gaining better insight into price movement. Furthermore, the XRP/BTC pair will also be analyzed for a better understanding.
Important Value Marks:
Resistance Levels: $0.4760, $0.5000, $0.5500
Support Levels: $0.4700, $0.4650, $0.4600
Ripple Price Prediction Today October 5, 2022: XRP/USD Upside Retracement
After Ripple’s price action was able to find a comfortable support at the 61.80 Fib Level it has continued moving to the upside. XRP/USD price candles are above the Moving Average of the applied Bollinger indicator. However, there has only been a minor correction in the Stochastic RSI lines, as it progresses into the oversold region. An eventual crossing over of the RSI lines will further brighten hopes of price increase in this market. Nevertheless, the fact that price action has been found support above the MA lines, portrays that price action may further move upwards from here. Summing up all the signs, we can predict that the XRP price may break the $0.5477.


Ripple Price Prediction Today October 5, 2022: ETH/BTC Price Searches for a Base
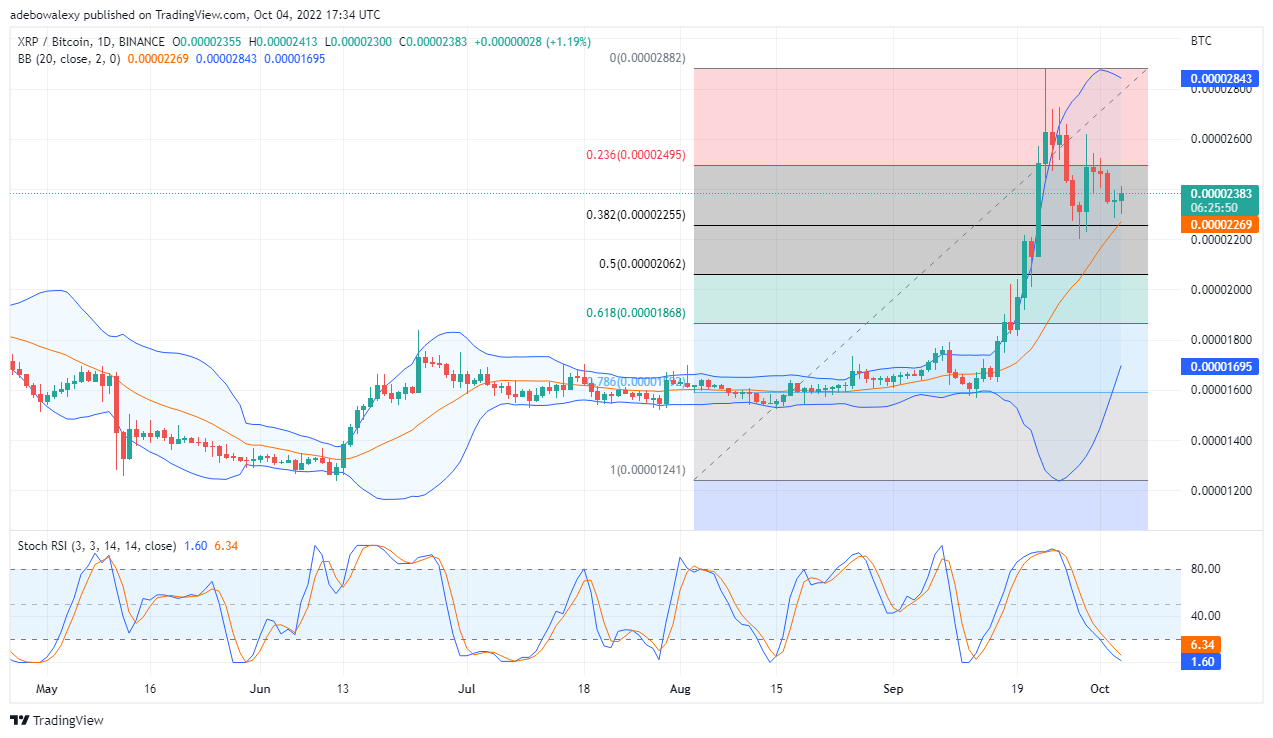
Also, the XRP/BTC market portrays similar characteristics to the XRP/USD market, as value movements stays above the MA. The current price of the pair lies almost symmetrically between the 23.60 and 38.20 Fibonacci levels without finding a support at the 38.20 Fib level.
Buy Ripple Now
Your capital is at risk.
However, the RSI lines are smoothly curved as they arrive in the oversold region. Consequently, the activities on the RSI signifies a gradual gain in the buying momentum judging by the appearance of the two most recent price candle. Trades in this market can place a long order, or simply wait till the RSI lines perform a crossover in the oversold area, to be sure of the significant upside momentum gain.
Tamadoge – Play to Earn Meme Coin
- Earn TAMA in Battles With Doge Pets
- Maximum Supply of 2 Bn, Token Burn
- Now Listed on OKX, Bitmart, Uniswap
- Upcoming Listings on LBank, MEXC
Join Our Telegram channel to stay up to date on breaking news coverage
Credit: Source link


