Ripple Price Prediction – June 9
The Ripple price remains range-bound but can this latest bullish momentum break above the 9-day and 21-day moving averages?
XRP/USD Market
Key Levels:
Resistance levels: $1.150, $1.300, $1.450
Support levels: $0.600, $0.450, $0.300
At the moment, XRP/USD is trading below the 9-day and 21-day moving averages with a small 0.84% price increase over the past 24 hours of trading as it reaches the $0.967 high. The Ripple price has been bouncing around within a range between $0.780 and $0.970 since the past few weeks of trading. Today, XRP/USD is found doing a surge as high as $0.967 but a break out above the 9-day and 21-day MAs could spark a bullish run for the coin and a push beneath the channel could spell disaster for the Ripple.
Ripple Price Prediction: Ready for the Upside?
However, the Ripple price continues to struggle below $1.00. It is currently consolidating at the negative side with support near $0.80. Therefore, if the price fails to stay above the $0.850 support zone, it is likely to resume its decline. Meanwhile, the first major support could be found near the $0.800 level, below this could revisit the main support at $0.780. Any further losses may perhaps start a significant decline towards the $0.600, $0.450, and $0.300 support levels.
On the upside, an initial resistance is near the $1.00 level above the 9-day and 21-day moving averages. To start a new rally, the Ripple price must cross the resistance levels of $1.100 and $1.130. Any further gains could lead the price towards the $1.150, $1.300, and $1.450 resistance levels. In other words, the technical indicator Relative Strength Index (14) is seen moving in the same direction around the 40-level, suggesting sideways movement for the market.
Looking to buy or trade Ripple (XRP) now? Invest at eToro!
75% of retail investor accounts lose money when trading CFDs with this provider
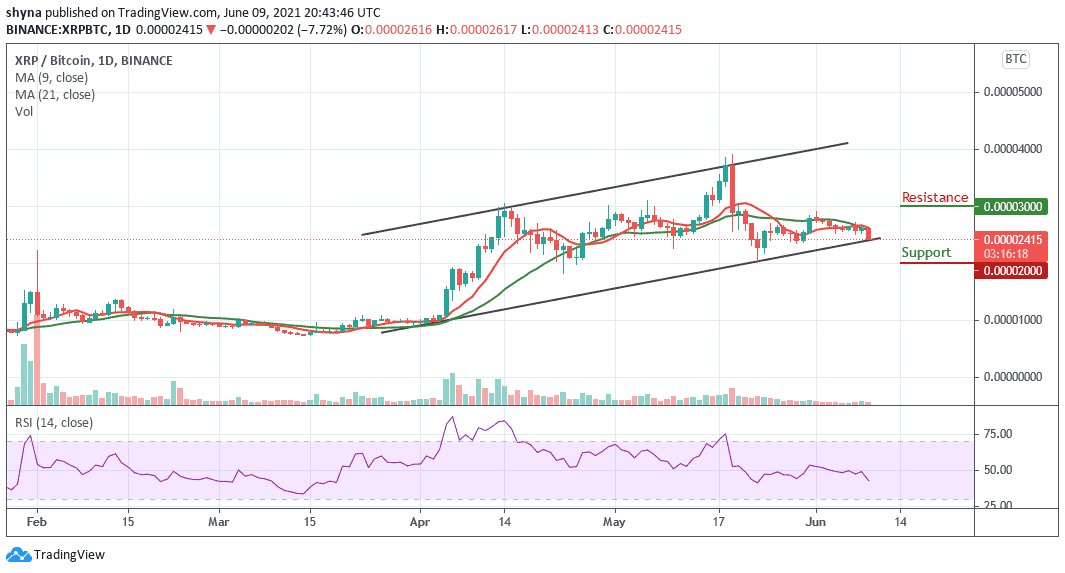
When compares with Bitcoin, the Ripple price is ranging and trading below the 9-day and 21-day moving averages within the channel. For now, the coin is likely to break below the lower boundary of the channel. Looking at the daily chart, both the bulls and the bears are struggling on who will dominate the market as the Relative Strength Index (14) moves below 50-level.

However, should the price fall below the lower boundary of the channel, the next key support level could be 2000 SAT and below. Meanwhile, on the bullish side, a possible rise could take the market to the resistance levels of 3000 SAT and above.
Looking to buy or trade Ripple (XRP) now? Invest at eToro!
75% of retail investor accounts lose money when trading CFDs with this provider
Credit: Source link


