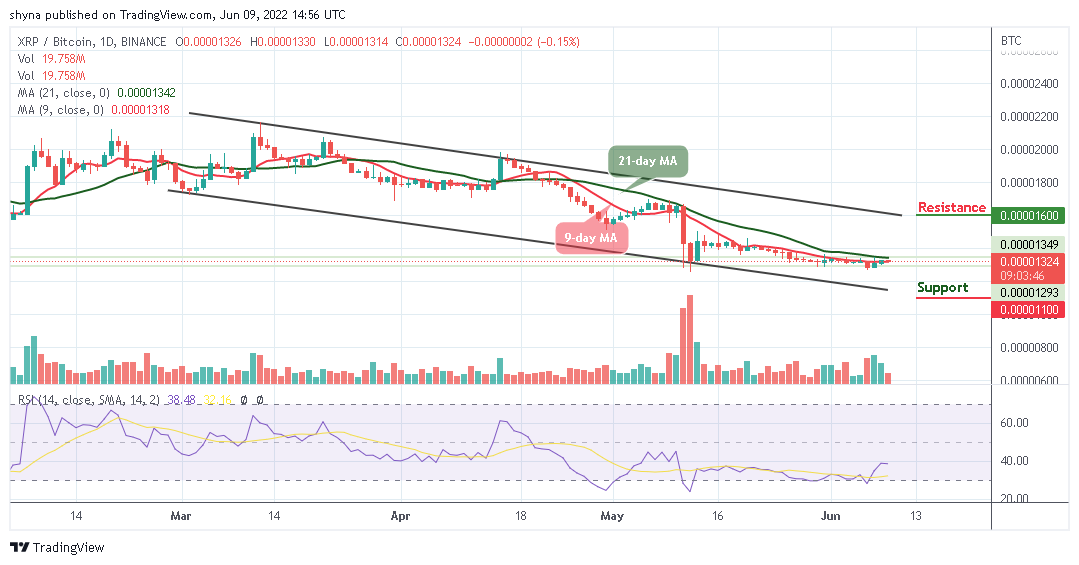
The Ripple price prediction shows that XRP is slightly ranging as the market continues to respect the $0.40 support.
Ripple Prediction Statistics Data:
- Ripple price now – $0.39
- Ripple market cap – $19.3 billion
- Ripple circulating supply – 48.34 billion
- Ripple total supply – 99.98 billion
- Ripple Coinmarketcap ranking – #7
XRP/USD Market
Key Levels:
Resistance levels: $0.55, $0.60, $0365
Support levels: $0.25, $0.20, $0.15
XRP/USD is trading sideways, losing around 0.12% during the negotiation today. Looking at the daily chart, the Ripple has been moving sideways for the past few days. Presently, the bulls are trying to come back into the market with a cross above the 9-day and 21-day moving averages, which may head towards the resistance level of $0.40.
Ripple Price Prediction: Would Ripple Price Head?
The Ripple price is consolidating within the market, and the coin may see a slight increase in the market as it is currently trading around $0.39. on the contrary, XRP/USD may continue to a sideways movement before any breakout or breakdown of the channel.
Moreover, should in case the price breaks above the upper boundary of the channel, the resistance levels of $0.55, $0.60, and $0.65 could be visited. Meanwhile, for a bearish movement, the market can be supported at $0.25 and $0.20, and should the price falls below the previous levels, another support could be found at $0.15 while the Relative Strength Index (14) stays above the 40-level.
When compared with Bitcoin, the Ripple price is currently changing hands at 1324 SAT, and it’s trading within the 9-day and 21-day moving averages. Therefore, if the above-mentioned level can serve as the market support, the Ripple price may likely face the key resistance at 1400 SAT. Reaching this level, XRP/BTC could break towards the upper boundary of the channel to hit the resistance level of 1600 SAT and above.

However, if the bulls fail to keep the price above the moving averages, the market may begin a downward movement and the coin could probably record further declines below the lower boundary of the channel. Breaking this barrier could take the market to the nearest support level of 1100 SAT and below while the signal line of the Relative Strength Index (14) moves below the 40-level.
eToro – Our Recommended Trading Platform
- CySEC, FCA & ASIC regulated – Trusted by Millions of Users
- Trade Crypto, Forex, Commodities, Stocks, Forex, ETFs
- Free Demo Account
- Deposit via Debit or Credit card, Bank wire, Paypal, Skrill, Neteller
- Copytrade Winning Traders – 83.7% Average Yearly Profit
68% of retail investor accounts lose money when trading CFDs with this provider.
Credit: Source link


