XRP Builds a Baseline at $0.30 – June 25
The Ripple (XRP) builds a baseline around the $0.30 support against the market’s US dollar worth. Currently, the price is around $0.36 at a negative percentage rate of 1.85That denotes there can be a slight correction in the near time.
XRP Price Statistics:
XRP price now – $$0.3595
XRP market cap – $17.5 billion
XRP circulating supply – 48.3 billion
XRP total supply – 100 billion
Coinmarketcap ranking – #6
XRP Builds a Baseline at $0.30
Key Levels:
Resistance levels: $0.40, $0.50, $0.60
Support levels: $0.30, $0.25, $0.20
XRP/USD – Daily Chart
The daily chart showcases the Ripple-XRP builds a baseline at the $0.30 trading level, having struggled to swing northward to the point of the smaller SMA trend line. The 50-day SMA indicator is above the 14-day SMA indicator. And there is a separating space between them as the bigger SMA stays at the $0.5164 resistance point and the smaller-SMA positions at a $0.3641 resistance. The Stochastic Oscillators are in the overbought region, suggesting that there may soon be a pit stop that can give birth to a brief correction.
Will the Ripple XRP/USD market keep above its support baseline?
The vital area of resistance is around $0.40. And the price has not to encounter aggressive correctional motion to keep afloat above as the XRP/USD market builds a baseline around the $0.30 support level. Long-position takers are wary of overleveraging their positions while making entries around the value line. They may wait for another round of lower-reading of the Stochastic Oscillators at reduced-range trending zones before considering a buying order afterward.
On the downside of the technical analysis, it may be a while before falling forces resume around the $0.40 resistance level. Based on that assumption, short-position takers are to be alert when the market faces an active reversal of any possible northward move intended to feature around the value line to go for a re-launch of selling orders. However, the market may resort to a range-trading set-up between the $0.30 and the market’s resistance level mentioned earlier.
XRP/BTC Price Analysis
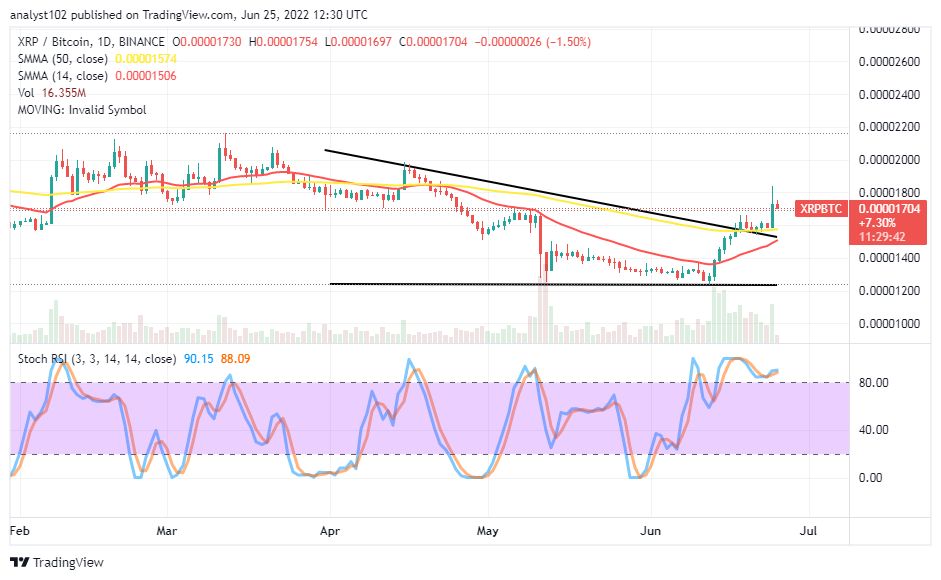
In comparison, Ripple XRP seems to have regained part of its lost momentum against the trending ability of Bitcoin. The cryptocurrency pair market builds a baseline below the trading SMAs. The 14-day SMA indicator has bent northward closely to the 50-day SMA indicator. There have been a few numbers of candlesticks formations at a close point above the bigger SMA to denote the base crypto is currently pushing higher against the counter crypto. The Stochastic Oscillators are in the overbought region, seemingly trying to consolidate within. A bullish candlestick emerged yesterday and has not to decimate by subsequent ones to save the base trading instrument from losing back to its countering trading crypto.
Looking to buy or trade XRP now? In-Content Heroes link!
68% of retail investor accounts lose money when trading CFDs with this provider.

Read more:
Credit: Source link


