Join Our Telegram channel to stay up to date on breaking news coverage
The 2022 crypto bear market has been extremely difficult for crypto investors. But, if you’re not too late, bear markets can lead to fantastic buying opportunities.
Following Bitcoin’s recent drop to a new 2-year low, many crypto traders are now wondering, “Has Bitcoin reached bottom?” For most technical indicators to be meaningful, the current BTC price action needs more time to play out.
However, last week’s record volume levels suggest that Bitcoin is nearing a major bottom. Why? Because record volume has historically led to large rallies in the months following. In this article, we’ll go over a few key charts to show you why Bitcoin may be nearing its bottom.
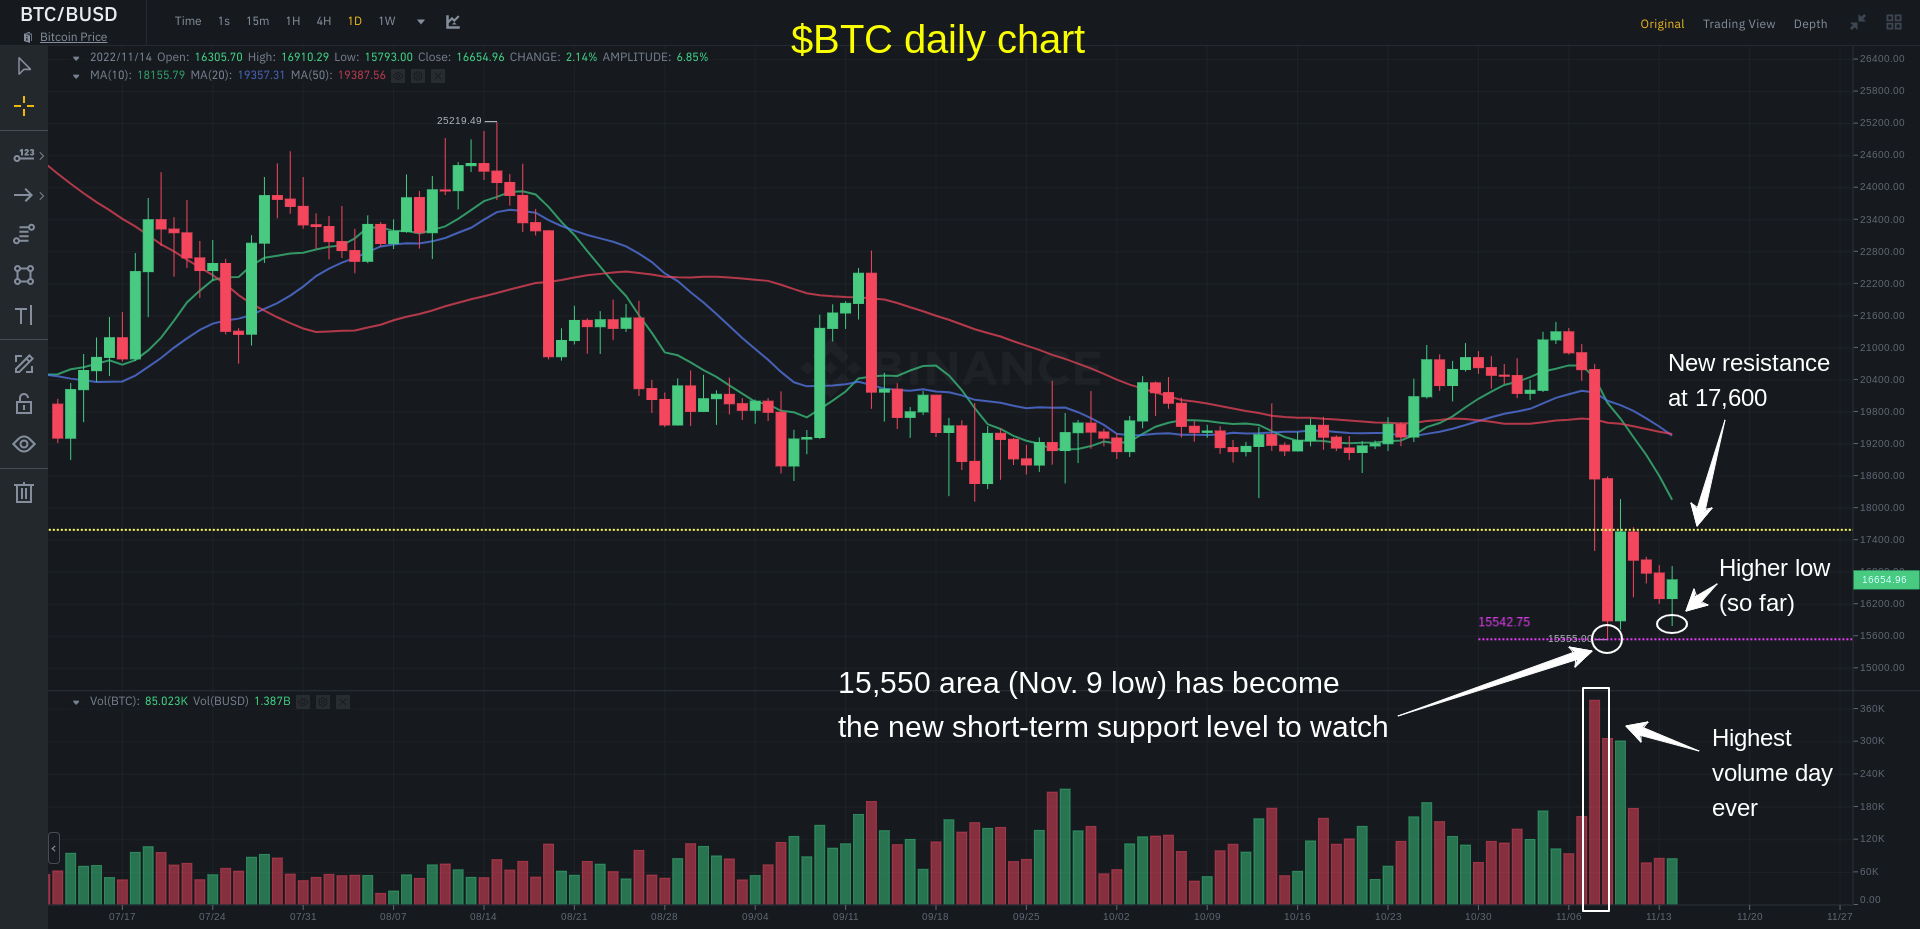
Following months of sideways price action, Bitcoin sliced through support of its June 2022 low to set a new 2-year low last week.
That previous support level of 17,600 (yellow line) has now turned into new, short-term resistance.
Nonetheless, despite Bitcoin’s new low, notice how new support of the prior downtrend line (purple line) kept the losses in check.
Because a previous level of resistance becomes the new support—AFTER the resistance is broken—that downtrend line has become support (and vice versa). This is a fundamental principle of technical analysis.
Last week’s breakdown to a new low was obviously bearish, but it also generated a significant positive signal—the highest BTC volume WEEK ever (as shown above).
The Highest Volume Day in Bitcoin History
Bitcoin not only had its highest volume week in history. BTC also experienced its highest volume DAY in history (November 8).

BTC’s current short-term support and resistance levels
When the price of bitcoin fell to a new low on November 8, it found support and bounced off the 15,550 mark (purple line). The price action sharply rebounded the next day, but notice how the rally stalled right at new resistance of 17,600. (yellow horizontal line).
This is an excellent example of how prior support can morph into new resistance (as explained earlier). In the short term, Bitcoin price is currently trapped between 15,550 and 17,600. A decisive move above or below either of these levels could result in high volatility.
Despite Bitcoin’s drop to new 2022 lows, selling pressure eased quickly following the November 8 sell-off that triggered a wave of forced liquidations (bullish due to less supply). In this news-driven environment, volatility could spike quickly, so we’re prepared for anything.
Is Bitcoin Nearing the Bottom? Volume Speaks for Itself!
Although the short-term trend of BTC does not appear to be favourable, recent volume patterns indicate a potential rally in the intermediate term.
As previously stated, Bitcoin recently experienced its highest daily and weekly volume ever.
What is the significance of high volume?
Although volume is frequently overlooked by newer traders, it is widely regarded as one of the most reliable and important technical indicators for crypto swing traders to monitor. The gasoline that propels market momentum in both directions is volume. It is a reliable indicator that never lies.
Some technical indicators can give misleading signals, but volume reveals what’s going on “under the hood.”
Massive volume spikes have historically preceded significant BTC rallies, as evidenced by the data below.
Take a look:
Top 7 Bitcoin Highest Volume Days (from highest to lowest):
1. The 8th of November, 2022
2. March 13, 2020
3. March 12, 2020
4. The 9th of November, 2022
5. June 13, 2022
6. May 19, 2021
7. June 15, 2022
Prior to last week’s record-breaking Bitcoin volume days, the previous six highest volume days had occurred in March 2020, May 2021, and June 2022.
Each of those three periods was preceded by a significant Bitcoin bottom.
How much did BTC rise after the previous highest volume days?
Each of the previous six highest volume periods marked a Bitcoin bottom, leading to a significant rally in the months that followed. Consider the following data:
March 2020 – BTC has increased by +163% in two months (3,800 to 10,000).
May 2021 – BTC formed a price bottom, then chopped sideways for two months before ripping +80% higher in six weeks (29,300 to 52,600).
June 2022 – Over a two-month period, BTC steadily gained +44% from its lows (17,550 to 25,200).
November 2022 ?
As the figures above show, major volume surges in Bitcoin have a tendency to occur before major bottoms.
Don’t forget that .. volume speaks loudly!
Will the bullish volume pattern in Bitcoin lead to another bottom?
If the above trend continues, BTC may be poised for an intermediate-term surge. Still, there must be some sort of impetus for the bulls to reclaim control in the short term.
One bright spot is that we may be approaching the point of no return in the cryptocurrency market. Bottoms are often formed in any financial market when there is blood in the streets.
Nonetheless, bottom fishing is a risky strategy and should not be attempted. Rather, it is recommended to wait for bullish price and volume confirmation before entering lower-risk crypto swing trades.
Right now patience is the name of the game, but keep an eye out for opportunities if history repeats itself.
Related
Dash 2 Trade – High Potential Presale
- Active Presale Live Now – dash2trade.com
- Native Token of Crypto Signals Ecosystem
- KYC Verified & Audited
Join Our Telegram channel to stay up to date on breaking news coverage
Credit: Source link


