Charlie Morris is the founder and Chief Investment Officer of crypto-asset data provider ByteTree Asset Management.
____
I want to re-examine the current macroeconomic environment and how it impacts the Bitcoin (BTC) price. It has been a rough week so far, but one thing I can be sure of is that Bitcoin loves hard-on macroeconomic conditions.
I wrote much about this in a report in conjunction with Bitstamp last summer, I concluded that Bitcoin is happiest when the economy is strong (bond yields are rising), with inflation rising concurrently.
The money map
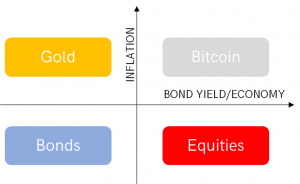
This simple model I concocted a decade ago lays out a framework to understand asset allocation. Below the line sit financial assets such as bonds and equities. These do well in a disinflationary environment, such as the one we have lived through since the early 1980s. Above the line are hard assets, such as gold (and TIPS), and Bitcoin (and commodities, heavy industry, emerging markets and banks). To the left, we have gold and bonds that are defensive when the economy is weak under “risk-off” conditions. On the right, the economy is expanding, the bond yield is rising, and conditions are said to be “risk-on”.
In summary, bonds and equities are soft assets, while Bitcoin and gold are hard assets. Bitcoin and equities prefer risk-on, while bonds and gold prefer risk-off. You can think of it like this; bonds like soft-off, equities soft-on, gold hard-off and Bitcoin hard-on. No giggling please, I am deeply serious here.
A decent hard-on requires not only inflation but economic growth to boot. Here I update the chart from the Bitstamp report, which demonstrates how Bitcoin has done best during risk-on conditions when the US 10-year government bond yield has been rising.
Bitcoin and the 10-year yield
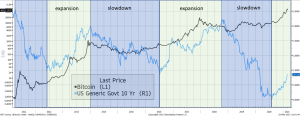
The high to low and low to high periods for the ten years are marked in blue and green, respectively. There have been six broad bond market regimes since 2011. Looking at the blue periods, Bitcoin rises from circa USD 1 to USD 6 in 2011/12. That’s a lot, but it was the very early days when huge gains were in the air. The second blue period started at USD 919 in late 2013, only to end at USD 673 in 2016 – a loss. The last period came about in the aftermath of the 2017 peak. The price was USD 6,545 in early November 2018 and USD 11,212 in August 2020 when the 10-year bond yield made its multi-year low.
Now turn to the green boxes. Starting at USD 6 in 2012, the price surges to USD 919. Huge. Then again, from USD 673, it surges to USD 6,545. Enormous. And most recently, USD 11,212, to whatever the price is while you read this. I’ll call it USD 50,000. Almighty.
87% of Bitcoin’s performance was delivered while the US ten-year bond yield has been rising.
The 87% is an update from 95%, which was the answer when I wrote the report. I was making the simple point that external factors matter, and you can’t escape that. If you start the exercise post-2013, when Bitcoin was in its infancy, this number jumps to 98%. Since the beginning of January 2014, USD 1 invested in Bitcoin became USD 1.25 in the slowdown environments, compared to USD 54.4 in the expansionary times. When I say Bitcoin likes a hard-on environment, I mean it.
What about inflation?
Moving onto Bitcoin and inflation, you get a similar picture, yet the results have not been quite so compelling. During the red inflationary periods, Bitcoin rose from USD 1 to USD 47 by 2013, then USD 432 to USD 9,299 between 2016 and 2018. And in the current cycle, a timely buy at USD 5,948 in March 2020 to today’s USD 50,000. For the blue deflationary boxes, you buy at USD 47, sell at USD 432, buy at USD 9,299, sell at USD 5,948, and would be out of the market today.
Bitcoin and the 10-year inflation expectations
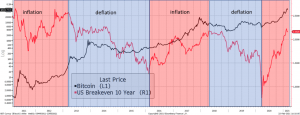
Being invested during the inflationary periods turned USD 1 into USD 8,504 in contrast to the deflationary periods, which became USD 5.88. Again, strip out the pre-2013 era, and it becomes clear that disinflation has been no friend of Bitcoin.
In other observations, I would highlight the speed at which Bitcoin responded to the inflationary regime changes in early 2016 and March 2020. In 2016, the Federal Reserve had just hiked rates for the first time since 2006, and in March 2020, they filled the helicopters with money, ready to be thrown out of the doors. Bitcoin has turned on a dime when conditions have turned in its favor.
In contrast, the Bitcoin price tops have been less clear in relation to inflation. Perhaps that’s because the peaks have not necessarily been linked to events, monetary or otherwise, unlike the troughs. In any event, Bitcoin likes monetary policy as it is. The risk would be a major change, which doesn’t seem likely at this moment in time, but it’s always best to be prepared.
What is the gold market telling us?
Gold performs best in a risk-off inflationary environment – hard-off. When real interest rates (bond yield less inflation expectation) are falling, there is rarely a better mainstream asset to own during such times. In recent weeks, real rates have started to rise (the black line has been inverted on the chart), which has put downward pressure on the gold price.
Gold and real rates
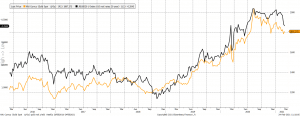
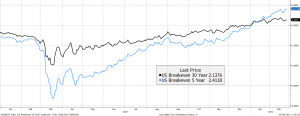
The market sees higher inflation as temporary, and I can illustrate this with the next chart. The more volatile five-year inflation expectations are at a seven-year high, while the 30-year expectations have recently stalled. The implication is that the bond market currently expects inflation to come and then pass.
Long-term inflation expectations have stalled
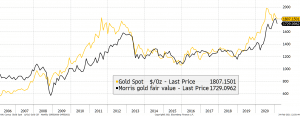
The youngsters in the Bitcoin space believe gold is irrelevant as it has been superseded. I very much doubt that is the case because gold is behaving as it should. It continues to trade in line with my fair value model. This has been incredibly useful over the years, and I am pleased to say that this will soon be available on the ByteTree Asset Management website, updated daily. I will keep you posted on that as we roll out BOLD (Bitcoin + gold) fund management services.
Gold is trading rationally
Higher bond yields work for Bitcoin in a way they don’t for gold. They won’t rise forever, or if they do, we are in real trouble. One thought is that the central banks impose yield curve controls (YCC) while inflation remains, which would be extremely bullish for gold. YCC may not necessarily be bad for Bitcoin, but I do believe it would turn the institutional fund flows and will be better for gold.
Looking at the current epoch (fourth period of Bitcoin block reward since 12 May 2020), money continues to leave the gold market and into Bitcoin.
Bitcoin still sees inflows, perhaps at gold’s expense
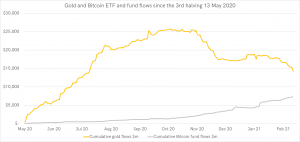
Over the fourth epoch, Bitcoin has now seen USD 7.429bn invested via funds alone. This excludes exchange flows and treasury holdings from Tesla, MicroStrategy, and so on. I focus on these because they are significant and provide a consistent sample of institutional activity, which can both rise and fall. This data will also be available on ByteTree Asset Management’s website before too long.
Consider how this money has accelerated Bitcoin’s advance and how little over USD 10bn of outflows have dented gold. I reiterate, the balance provided by BOLD becomes ever-more appealing in an inflationary era. With gold fairly priced and away from the hype cycle, I feel this concept is very timely indeed. Always be ready for the hard-off.
___
Learn more:
– Bitcoin Snowball Is Expected To Hit More Institutions in 2021
– Not Only Bitcoin Price Is Changing During This Bull Run
– Crypto in 2021: Bitcoin To Ride The Same Wave Of Macroeconomic Problems
– Crypto in 2021: Institutions Prefer Bitcoin, Retail Open to Altcoins
Credit: Source link


