Bitcoin seems to be losing steam as it trades back and forth between $59,000 and $60,000. In the daily chart, BTC is moving sideways (0.3%) after a week with modest gains of 4.9%.
Trader Josh Rager has set support for BTC at $59,000. Holding this level could give it enough momentum to retest the $60,600 area. The trader expects “new highs” by Wednesday.
On-chain data seems to support this prediction, as shown by CryptoQuant shared by “Byzantine General”. BTC reserves for the spot market continue their downtrend and indicate a “consistent demand”. This trader said:
Except for those 2 inflow outliers most significant flows have been outflows. This massive consolidation range that we’re in sure looks a lot like re-accumulation.
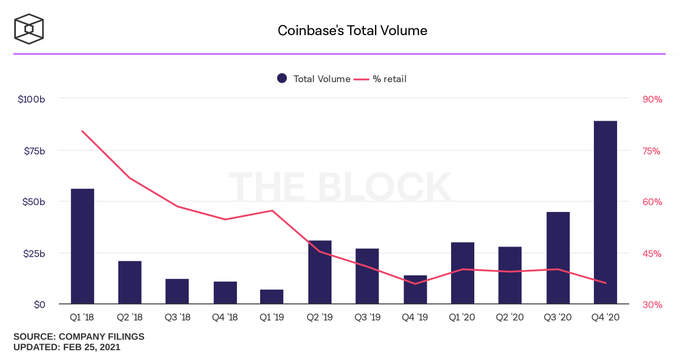
Further evidence suggests that Bitcoin’s current price action is driven by institutions unlike the previous bull-run in 2017. Besides from Google search volume for “Bitcoin” is at a relatively low, Coinbase trading volume has skyrocketed since Q3 and Q4, 2020.
However, on this metric, the percentage of retail investors has trended downwards, as the following graph demonstrates. The trader said:
Last bull run we were talking about institutions coming, but now they’re actually here, and they’re buying.

Bitcoin 4 years cycles could change
On April 14, crypto exchange Coinbase will go public on the U.S. stock market. Under the ticker COIN, the trading platform will be one of the first major crypto companies on the traditional market.
This moment converges with VISA testing stablecoins, PayPal expanding its crypto services, Tesla integrating Bitcoin as a payment method. The above could play an important role during this week as the 14th approaches. The trader said:
That doesn’t mean there won’t be any corrections anymore. Of course not, I mean we’ve seen three massive (liquidations) corrections this year alone. But, this bull run could be different. Maybe the 4 year cycle structure that we’re used to from bitcoin could break.
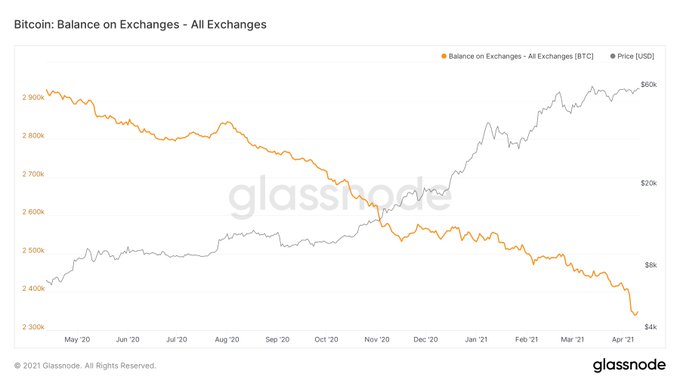
Two additional key metrics are the percentages of BTC trading above 1 Trillion USD market cap and the amount of BTC on exchanges. The former is estimated at 11% as BTC’s price trades above $53,000 which points to a “validation” of the current price, as stated by analyst William Clemente.

On the latter, there is a correlation between the miners and long-term holders keeping their BTC and the increased supply outflow from the trading platform. Clemente added:
In combination with exchange withdrawals, supply is becoming increasingly illiquid. This means the new wave of institutional demand (just beginning) must compete for the mere 2.3M coins left on exchanges.
Credit: Source link


