Join Our Telegram channel to stay up to date on breaking news coverage
Bears dominate VeChain market
VeChain Price Analysis – 17 November
When VET breaks down the support level of $0.018 level, it may decrease to $0.017, and $0.016 support levels. The closing of the daily bullish candle above the $0.020 level may increase the price to $0.021 and $0.022 levels. The relative strength index period 14 is at the 39 level pointing downside to indicate a sell signal.
VET Price Analysis – 17 November
Key Levels:
Resistance levels: $0.020, $0.021, $0.022
Support levels: $0.018, $0.017, $0.016
VET/USD Long-term Trend: Bearish
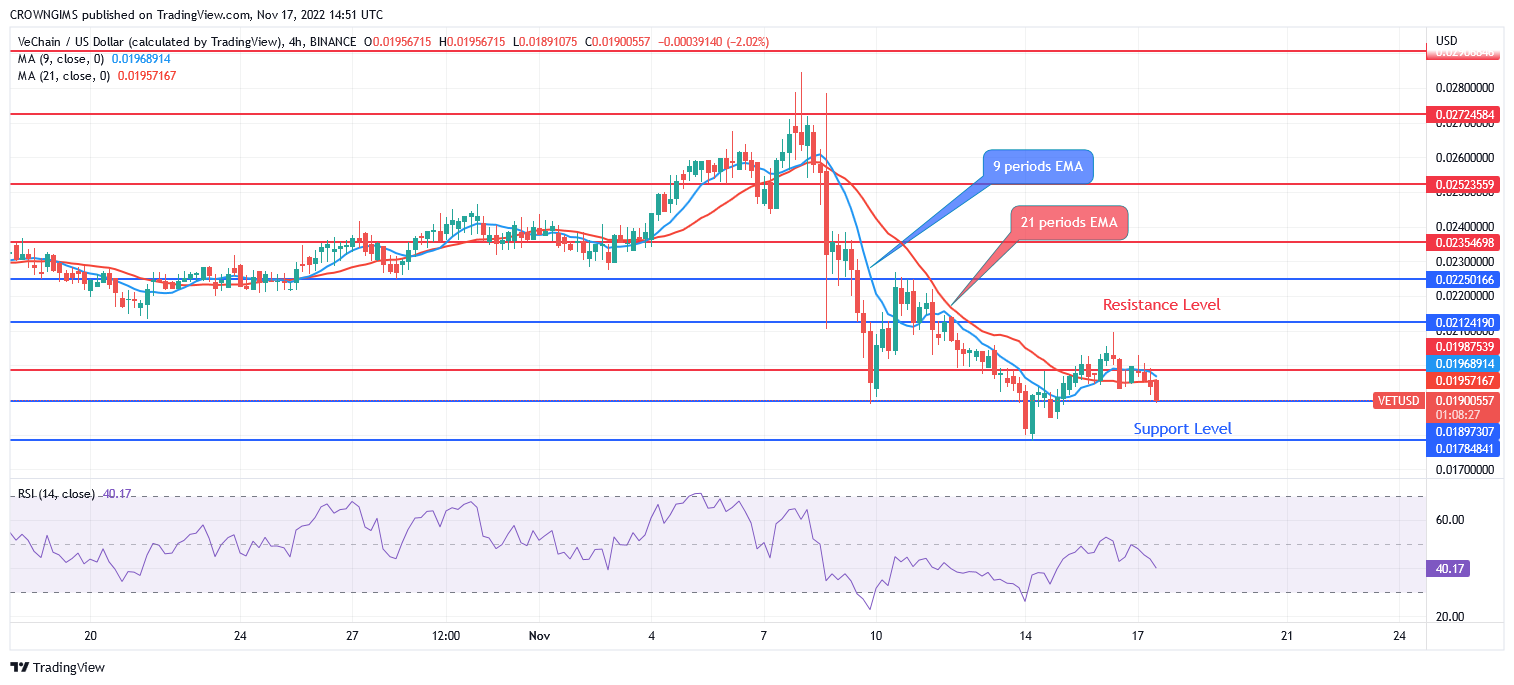
VeChain is on the bearish movement in the daily chart. VET has lost 16.78% of its volume within 24 hours. The Crypto suddenly drop from the high of $0.027 to the $0.017 support level. The buyers were able to push the coin to the resistance level of $0.027 on 07 November. Sellers gained more momentum and this is noticed when a strong bearish engulfing candle emerged. Following the scenario is the formation of more bearish candles and the price is reduced to $0.017 At the moment. The coin sits on the $0.018 level.
On the daily chart, VET/USD is trading below the two EMAs. The 9 periods EMA has crossed the 21 periods EMA downside as a confirmation of a downtrend. When VeChain breaks down the support level of $0.018 level, it may decrease to $0.017, and $0.016 support levels. The closing of the daily bullish candle above the $0.020 level may increase the price to $0.021 and $0.022 levels. The relative strength index period 14 is at the 39 level pointing downside to indicate a sell signal.
VET/USD Medium-term Trend: Bearish
VeChain is bearish in the medium time frame. The buyers lose momentum at the resistance level of $0.027 level. Sellers’ pressure was increased and the price broke down former support levels of $0.023, $0.022, and $0.021. The low support level of $0.017 was tested on 14 November. It pulled back to retest the resistance level of $0.021.

VeChain is trading below the two EMAs as a sign of a bearish market. The Relative Strength Index period 14 indicator is at 43 levels displaying a bearish market direction. In spite of the general bearish trend experienced in the Crypto world, many investors are making a profit in IMPT tokens and D2T tokens.
Many Investors Are Interested in IMPT Token
Daily, buyers are increasing rapidly, investing in the Impact Token presale. Within several weeks, it has realized nearly $112.5 million in the ongoing presale.
This Is the Best Time to Buy Dash 2 Trade (D2T)
Dash 2 Trade (D2T) presale has acquired $6.5 million at the moment. Also, the CZ of Binance declared an industry recovery plan for crypto projects; this is an excellent time to invest in D2T tokens.
Related
Dash 2 Trade – High Potential Presale
- Active Presale Live Now – dash2trade.com
- Native Token of Crypto Signals Ecosystem
- KYC Verified & Audited
Join Our Telegram channel to stay up to date on breaking news coverage
Credit: Source link


