Join Our Telegram channel to stay up to date on breaking news coverage
After a successful break above the 9-day and 21-day moving averages, the Universal Market Access price prediction extended its recovery to touch the resistance level of $1.47.
Universal Market Access Prediction Statistics Data:
- Universal Market Access price now – $1.39
- Universal Market Access market cap – $101.5 million
- Universal Market Access circulating supply – 73.6 million
- Universal Market Access total supply – 115.2 million
- Universal Market Access Coinmarketcap ranking – #182
UMA/USD Market
Key levels:
Resistance Levels: $1.70, $1.80, $1.90
Support Levels: $1.15, $1.05, $0.95
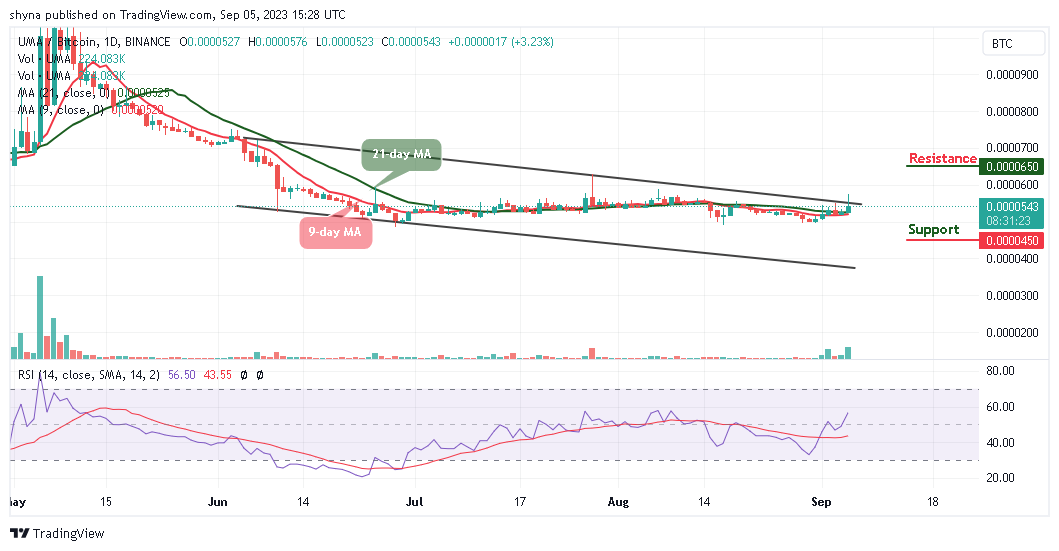
According to the daily chart, UMA/USD retreats below the daily high of $1.47. The Universal Market Access price is still hovering above the 9-day and 21-day moving averages and the movement is very fragile at the moment. During a short-term breakout, critical support levels may need to be monitored as the crypto could head toward the upper boundary of the channel.
Universal Market Access Price Prediction: Is UMA Bull Run Still Intact?
The Universal Market Access price increases more than 2.59% as the coin moves to touch the resistance level of $1.47. Moreover, the cryptocurrency begins the day at $1.35 level before heading toward the upper boundary of the channel. Therefore, a sustained movement above the channel could hit the resistance levels of $1.70, $1.80, and $1.90 respectively.
On the contrary, there could be more losses if there is no break above the $1.50 resistance. Therefore, if there is a downside break toward the lower boundary of the channel, the Universal Market Access price may accelerate its decline to the support levels of $1.15, $1.05, and $0.95 while the Relative Strength Index (14) moves to cross above the 50-level.
UMA/BTC Aims at the Upside
Against Bitcoin, the Universal Market Access price would need to recover above 576 SAT to mitigate the short-term bearish pressure and allow for an extended recovery toward the resistance level of $650 and above. However, a sustainable move below the 9-day and 21-day moving averages may open up the way toward 500 SAT.

Nevertheless, the critical support could be located at 480 SAT, and a sustainable move lower could increase the downside pressure and push the price toward the support of 450 SAT and below. Considering that the Relative Strength Index (14) signal line is moving to cross above the 60-level, traders might expect more bullish signals to play out.
Universal Market Access Alternatives
The Universal Market Access bulls are trying to push the coin toward the upper boundary of the channel as the technical indicator Relative Strength Index (14) reveals that the market may embark on a positive movement if the signal line crosses above the 50-level.
Meanwhile, amidst the decline of some popular tokens, the Wall Street Memes token continues to be rated a “buy” because of its attractively low presale price, resulting in gains of over $25 million. The optimal strategy is to secure some tokens now before their price experiences a rapid ascent.
Wall Street Memes – Next Big Crypto
- Early Access Presale Live Now
- Established Community of Stocks & Crypto Traders
- Featured on BeInCrypto, Bitcoinist, Yahoo Finance
- Rated Best Crypto to Buy Now In Meme Coin Sector
- Team Behind OpenSea NFT Collection – Wall St Bulls
- Tweets Replied to by Elon Musk
Join Our Telegram channel to stay up to date on breaking news coverage
Credit: Source link


