Join Our Telegram channel to stay up to date on breaking news coverage
The Solana price prediction needs to cross above the 9-day and 21-day moving averages quickly to deny the bears into the market.
Solana Price Statistics Data:
- Solana price now – $20.18
- Solana market cap – $8.2 billion
- Solana circulating supply – 408.8 million
- Solana total supply – 556.7 million
- Solana Coinmarketcap ranking – #9
SOL/USD Market
Key Levels:
Resistance levels: $28.0, $30.0, $32.0
Support levels: $13.0, $11.0, $9.0
SOL/USD is currently hovering above $20.0 as the coin prepares to gain more bullish signals. The movement to the upside may not allow the coin to bow to the selling activity going on in the market. However, Solana (SOL) is likely to cross above the 9-day and 21-day moving averages. In the short term, bearish momentum is very likely especially if the bulls fail to hold the price above $20.44 and the red-line of the 9-day MA is still below the green-line of the 21-day MA.
Solana Price Prediction: Would Solana (SOL) Continue Higher?
The Solana price may need to rise and break above the 9-day and 21-day moving averages before resuming the previous bullish trend but may remain beneath for a while before turning bullish. Therefore, if the sellers push lower, traders can expect very strong support at $18.0; this could then be followed up with another support at $16.0. If the bears push further below, additional supports may be located at $13.0, $11.0, and $9.0.
In the meantime, if the buyers continue with the bullish movement, the first level of resistance could be found at $22.0. Further bullish movement could hit the potential resistance levels at $28.0, $30.0, and $32.0 while the Relative Strength Index (14) moves above the 40-level to indicate an average bullish movement within the market. However, if the technical indicator dips beneath this level, the Solana price may head lower to the downside.
SOL/BTC Could Head to the North
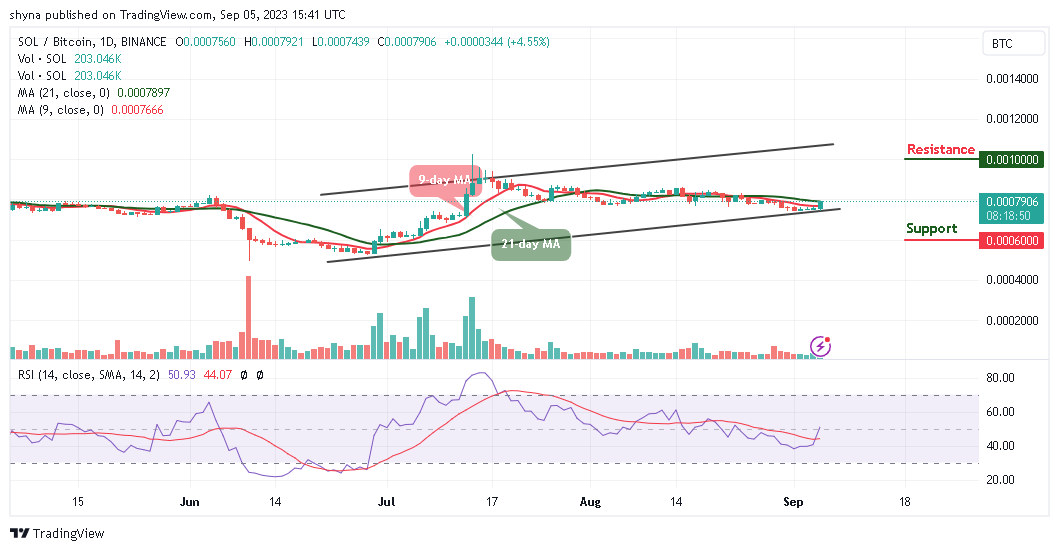
Against Bitcoin, the Solana price keeps trading as the market keeps moving sideways. SOL/BTC is currently trading at 790 SAT and the coin prepares to cross above the 9-day and 21-day moving averages. However, if the price slides below the lower boundary of the channel, the next key support may come at 600 SAT and below.

Meanwhile, a continuous bullish movement could push the market toward the upper boundary of the channel, a break above this barrier may enable the Solana price to reach the resistance level of 1000 SAT and above as the Relative Strength Index (14) moves to cross above 50-level, which shows that the market might experience further bullish movement.
Alternatives to Solana
According to the daily chart, the Solana price is moving close to the resistance level of $21.0 as the coin prepares to create an additional gain. Meanwhile, the technical indicator Relative Strength Index (14) is also moving above the 40-level, suggesting a buy signal in the market.
However, concerning $WSM, there are no team tokens in sight. Wall Street Memes boasts a remarkably robust and thriving community, and the prudent course of action is to acquire the token at this juncture, not in the future. The presale’s triumph serves as a testament to the confidence investors have already shown in $WSM, a confidence poised to yield substantial rewards, with over $25 million amassed so far.
Wall Street Memes – Next Big Crypto
- Early Access Presale Live Now
- Established Community of Stocks & Crypto Traders
- Featured on BeInCrypto, Bitcoinist, Yahoo Finance
- Rated Best Crypto to Buy Now In Meme Coin Sector
- Team Behind OpenSea NFT Collection – Wall St Bulls
- Tweets Replied to by Elon Musk
Join Our Telegram channel to stay up to date on breaking news coverage
Credit: Source link


