Solana Price Prediction – May 18
The SOL/USD market price tends to lose momentum at $60 as the price has seemingly begun a necessary correctional signal closely beneath the value line. The crypto’s price has been rising and falling between $57 and $54 at a negative percentage rate of 4.42.
Solana (SOL) Stastics:
SOL price now – $54.71
SOL market cap – $18.4 billion
SOL circulating supply – 337.36 million exactly
SOL total supply – 511.6 million
Coinmarketcap ranking – #8
SOL/USD Market
Key Levels:
Resistance levels: $70, $80, $90
Support levels: $40, $30, $20
SOL/USD – Daily Chart
The daily chart reveals the SOL/USD market tends to lose at a $60 trading level. The trade has been over a session, trying to reach the line. Candlesticks emerging in the last few days suggest that price may undergo some depression in the following trading days if the point mentioned earlier remains not fearfully breached to the moon side. The 50-day SMA is above the 14-day SMA. The Stochastic Oscillators have moved northbound from the oversold region, seemingly trying to slant back southbound closely below the 80 range.
Will the SOL/USD market hold back from dropping beyond the $40?
It is necessary that the SOL/USD market operation witness a slight correction from its current trading line to normalize swinging back for getting reliable ups within the support levels specified above. At this point, it appears the market strength force to the upside has been almost exhausted, as showcased by the reading of the Stochastic Oscillators. Therefore, patience is needed to exercise toward the launching of new buying order positions.
On the downside of the technical analysis, the SOL/USD market sellers have already had a selling wall built during May 11 downward-moving motions underneath the smaller-SMA trading indicator. The bearish waves leftover in the crypto market may still create a negative impact to lead the market back into a bearish trending move beneath the sell signal sides of the SMAs. Nevertheless, long-term investors may now deem it fit to consider joining.
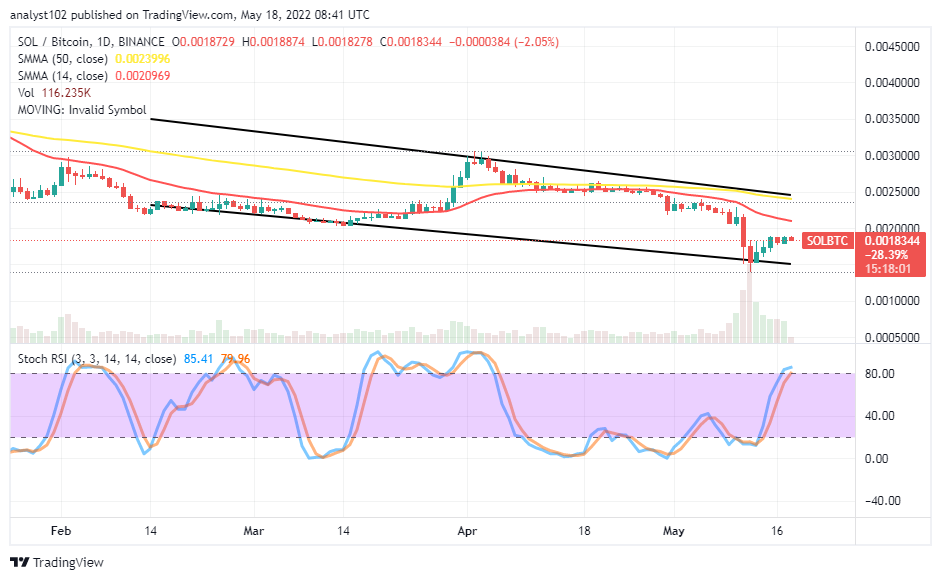
SOL/BTC Price Analysis
Solana is struggling to rebuild its stance against Bitcoin’s trending capability. The cryptocurrency pair market tends to lose around the trend line of the smaller SMA. The 14-day SMA indicator is beneath the 50-day SMA indicator. The Stochastic Oscillator is almost moved fully into the overbought region. But, they are now trying to cross their lines at the range of 80 to signify the base trading crypto is on the verge of losing back to the pushing weight of the counter-trading crypto soon.
Looking to buy or trade Solana (SOL) now? Invest at eToro!

68% of retail investor accounts lose money when trading CFDs with this provider.
Read more:
Credit: Source link


