Ripple Price Prediction – August 10
The Ripple price prediction is improving as the coin is now hovering above the upper boundary of the channel.
XRP/USD Market
Key Levels:
Resistance levels: $0.98, $1.00, $1.02
Support levels: $0.64, $0.62, $0.60
XRP/USD settles above the 9-day and 21-day moving averages as the sixth-largest digital asset has gained nearly 4.38% in the recent 24 hours and touched the intraday high at $0.86 before retreating to $0.81. At the time of writing, the Ripple price is hovering above the moving averages as the Relative Strength Index (14) moves to cross into the overbought region.
Ripple Price Prediction: Would Ripple price Keep the Uptrend?
Looking at the daily chart, traders can see that the Ripple price resumes an upward movement and a breakout above the upper boundary of the channel could dictate the direction in which the coin may be heading to. Therefore, if the price collapses beneath the 9-day moving average, it may turn bearish and a break above the overbought region could put the Ripple (XRP) on the bullish footing.
However, if buyers can keep the coin above the moving averages, the first level of resistance may come at $0.95 level. Any further movement above this may hit the potential resistance at $0.98, $1.00, and $1.02 levels. On the downside, the support at $0.75 should hold the moving forward. If the market pushes beneath, the market may turn bearish and further support levels could be located at $0.64, $0.62, and $0.60 respectively.
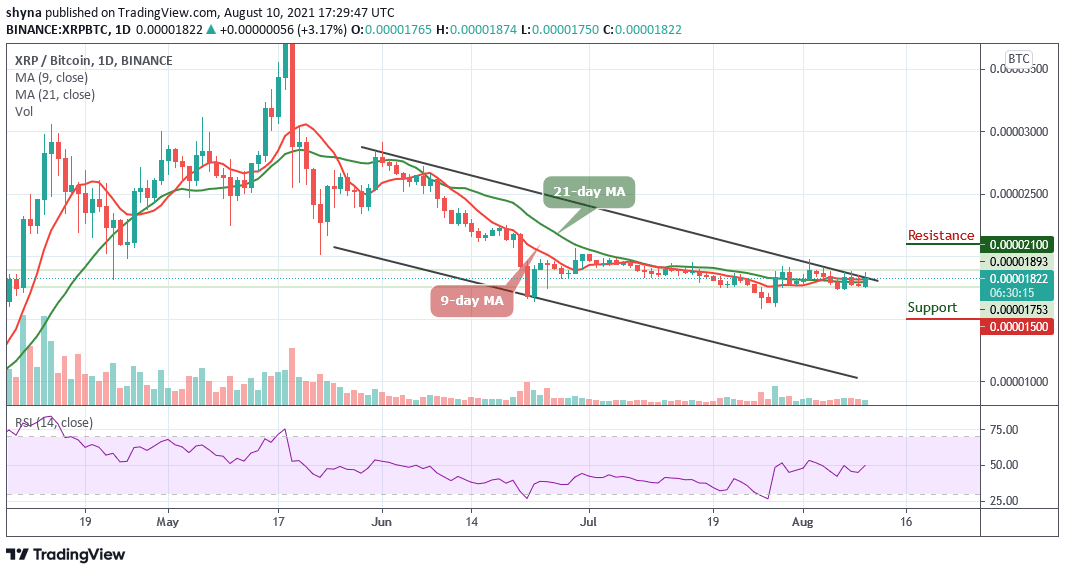
Against Bitcoin, the Ripple price is trading around the 9-day and 21-day moving averages. Meanwhile, the price action has remained intact within the channel and if the selling pressure steps back, the Ripple (XRP) may create a new low. At the time of writing, the technical indicator Relative Strength Index (14) is likely to cross above 50-level; if this is possible, traders may continue to see a positive move in the market.

On the contrary, as the daily chart reveals, XRP/BTC is currently moving at 1822 SAT which is around the upper boundary of the channel. If the price falls below the opening price of 1765 SAT, traders may expect close support at 1600 SAT before breaking to 1500 SAT and critically 1400 SAT while a bullish movement could locate the resistance level of 2100 SAT and above.
Looking to buy or trade Ripple (XRP) now? Invest at eToro!
75% of retail investor accounts lose money when trading CFDs with this provider
Credit: Source link


