Polkadot price has steadied itself above the $8 price mark. The coin seems to be extending the price recovery as DOT looks at moving past its next price ceiling. It also formed a bullish pattern on its daily chart.
The cup and handle pattern that Polkadot has been forming for the past two months indicate that the bulls were strong in the market. The cup and handle pattern usually indicates a bullish continuation of price. Over the past week, Polkadot price surged over 24% marking strong recovery.
DOT has been among the highest gainer within the top 10 cryptocurrencies based on market cap. In the last 24 hours itself, Polkadot price rose 6%. Technical indicators have painted bullishness on the chart with DOT exhibiting chances to break past $9 price ceiling.
Polkadot has struggled for a significant amount of time as price of the asset remained below the $9 price mark. Buying strength despite a recent fall shot up indicating that bulls were in control of the price.
If DOT manages to break past the aforementioned price ceiling, then the uptrend would invalidate chances of bears reclaiming the price.
The global cryptocurrency market cap today was $1.13 Trillion and it noted a 1.1% increase over the last 24 hours.
Polkadot Price Analysis: Four Hour Chart
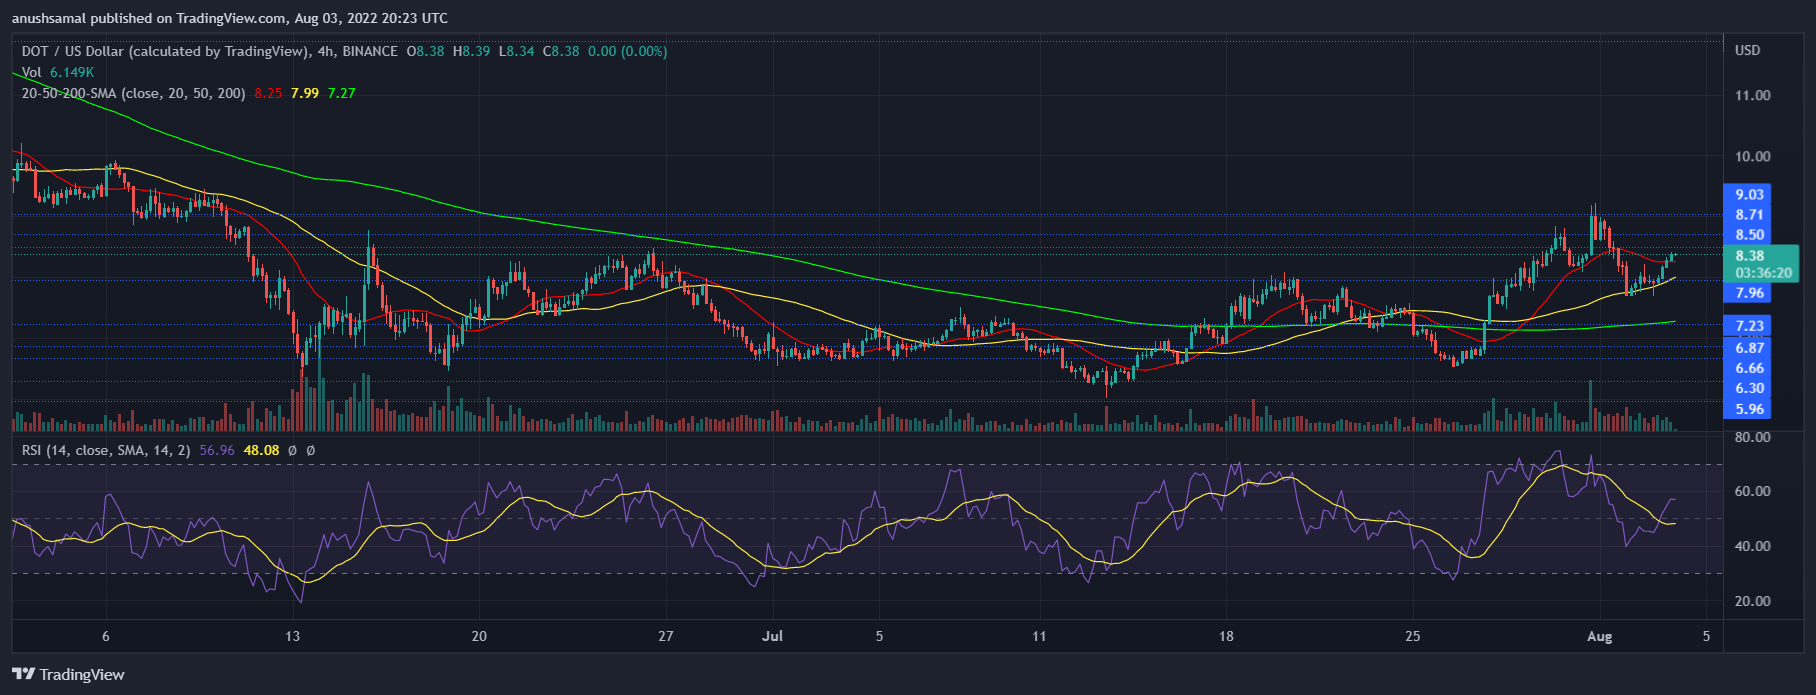
DOT was trading for $8.38 at the time of writing. A slight push from the bulls can send Polkadot price above $9 price mark. Ever since the middle of June, Polkadot struggled to break past the aforementioned price ceiling.
If DOT manages to trade above the $9 price mark for a significant amount of time, it could attempt to trade in double digits. A fall from the present price level will cause the altcoin to touch the $7.40 support line.
Polkadot price has formed higher highs on the four-hour chart, so chances of a price correction cannot be ruled out. Volume of DOT traded fell considerably in the previous trading session which was a sign of decreased buying strength. At press time, however, the technical outlook pointed towards an increase in buying pressure.
Technical Analysis

The altcoin Polkadot was positive on the four-hour chart as the major indicators pointed towards the same. As the asset formed higher highs, buying strength also resurfaced. The Relative Strength Index was pictured above the half line as buyers regained confidence signalling bullishness.
A tiny downtick on the RSI is visible, which meant that going forward DOT may lose its current price momentum. If buying strength remains consistent, a move above $9 is certain. Polkadot price was just above the 20-SMA line which signals that buyers were driving the price momentum in the market.
Related Reading | Polkadot Loses Steam As DOT Sheds 10% After Weekly Gains

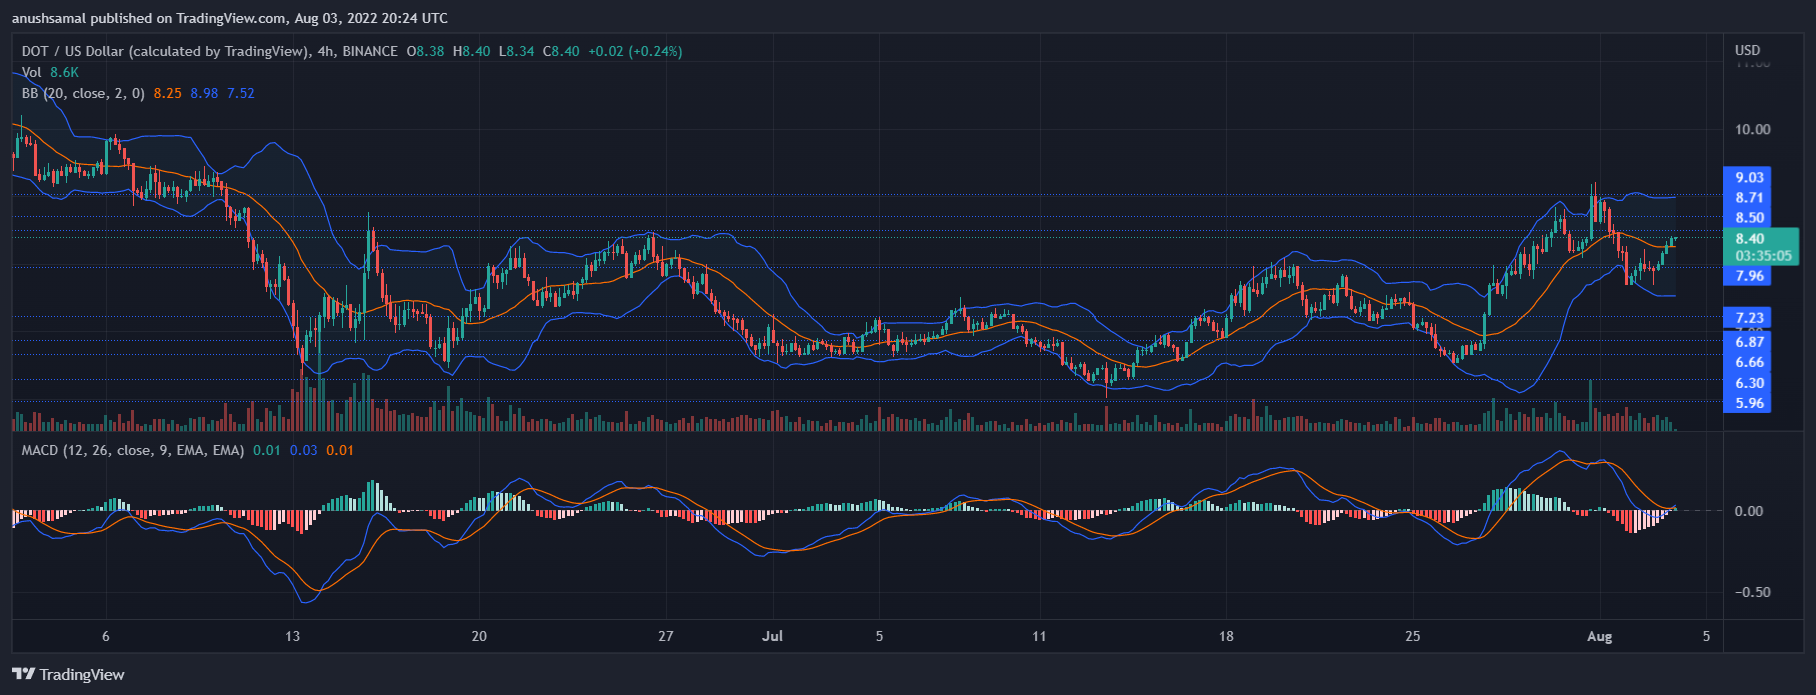
DOT continued to indicate positive price action on the four hour chart. Moving Average Convergence Divergence depicts momentum and price direction. MACD painted a green signal bar which is the beginning of a buy signal after undergoing a bullish crossover.
Bollinger Bands determine the price volatility and possibility of fluctuations in the same. The bands remained parallel which is a sign of constricted price action with less price volatility. Increase in buying strength can help Polkadot price to break its immediate price ceiling.
Related Reading | Solana Hot Wallets Suffer Ongoing Attack, Roughly $5M Stolen Thus Far
Featured image from PixelPlex, chart from TradingView.com
Credit: Source link


