Join Our Telegram channel to stay up to date on breaking news coverage

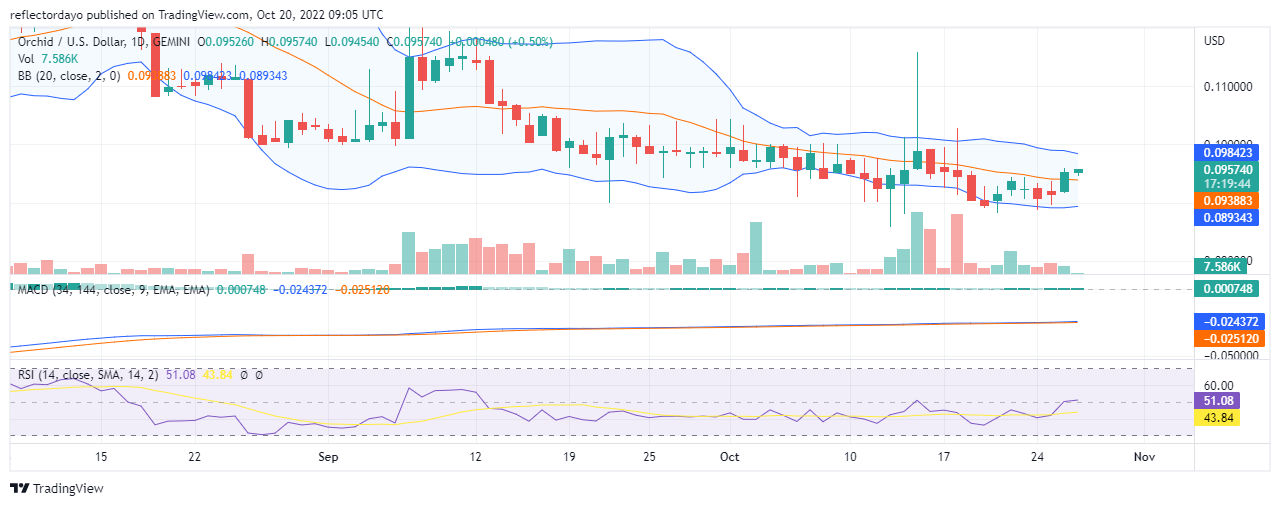
After the period of price consolidation at around $0.1150, which lasted from the 7th to the 13th of September, a long-term bearish trend broke out. But, the bulls have, since the inception of the bearish trend, been trying to stop it. From the 26th of September to the 30th of September, the Orchid market went completely flat due to a fruitless price struggle between buyers and sellers. And this was not due to a lack of interest to buy and sell the crypto. The price went into a consolidation period because selling pressure is responsive to buying pressure. When you look at the volume of trade for those days on the chart (where we have the spinning tops candle) you will see that the volume of trade for those days was high.
Orchid Market Price Statistic:
- OXT/USD price now: $0.09364
- OXT/USD market cap: $64,675,006
- OXT/USD circulating supply: 690,690,083.77
- OXT/USD total supply: 1,000,000,000
- OXT/USD coin market ranking: #314
Key Levels
- Resistance: $0.100, $0.110, $0.120
- Support: $8.123, $7.000, $6.500
Orchid Market Price Analysis: The Indicators Point of View
Although the struggle between bulls and bears made the Orchid market undecided for some time, sellers began to have an upper from the 2nd day of October as the price activities on the chart began to slightly move downwards. The Bulls made strong attempts to change the trend but all to no avail. The bullish market on the 15th of October took the price far above the $0.1100 resistance level, but sellers cut the price short and it falls back into the boundary of the normal support and resistance of the market activities. Despite all this wide pull and push of the price, and the high volume of trade in those days of volatile market behavior, the Bollinger band did not respond by widening up its bands. The indicator continues to maintain its bands along the horizontal level. However, in today’s market, we are witnessing a bullish recovery the RSI line has made it into the bullish zone.

OXT/USD 4-Hour Chart Outlook
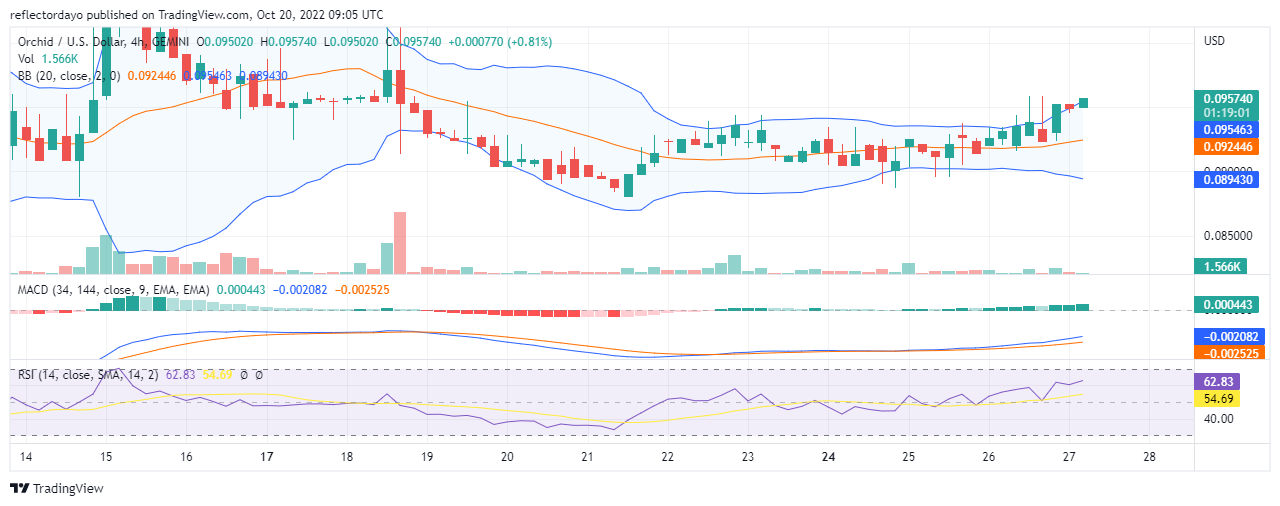
The upper band of the Bollinger indicator is beginning to respond to the changes in price activities. Even the moving average of the Bollinger band is respond by changing direction to an upward position. the latest candle pattern is not out of the bands; this means the bullish move is very likely to continue and ultimately the bullish price behavior in this outlook will soon reflect in the daily chart outlook.
The Dash 2 Trade pre-sale is off to an incredible start, having already raised significantly more than $2 million in a short period. The presale is made up of 9 stages, and each level sees a slight price increase. At this point, the second stage’s price increased to $0.05.
Related
Dash 2 Trade – High Potential Presale
- Active Presale Live Now – dash2trade.com
- Native Token of Crypto Signals Ecosystem
- KYC Verified & Audited
Join Our Telegram channel to stay up to date on breaking news coverage
Credit: Source link


