Litecoin Swings Lower in Ranges – June 13
The market worth of LTC/USD now swings lower in the range-bound zones to trade around the level of $159 at a percentage rate of around -1.28 as of writing.
Swings Lower in Ranges: LTC Market
Key Levels:
Resistance levels: $200, $250, $300
Support levels: $130, $1200, $110
LTC/USD – Daily Chart
The LTC/USD daily chart showcases that the crypto swings lower at the range-line of $150. There have yet been some volatile price movements around the lower range trading zone that the market has over time been keeping. As a result, all the SMA indicators as well feature not much difference in their stances on the chart. The 50-day SMA is situated above the 14-day SMA with a small space between as the bearish trend-line drew across them from the top to the downside. The Stochastic Oscillators’ lines are slightly opened pointing toward the southbound between ranges of 40 and 20. That signifies a downward force is somewhat ongoing.
As price swings lower around the LTC/USSD range-bound zones, will it still be prolonged?
The trade operation between Litecoin and the US Dollar swings lower overly around the lower range-bound zone of the market. The major range values of $150 and $200 are still intact as price continues to swing around them. Bulls are as well yet over the time trying to locate support basically around the lower range-line. But, they’ve not been putting much-needed efforts to stage a sustainable rebound. However, much is being expected of them by finding decent entries especially, while price goes dip more notably below the lower range-line of the market.
Up till the present, bears have between the range-bound zones the opportunity to push against any eventual active upswing that price tends to make. In the meantime, the immediate resistance level of $200 remains the best area of entry to stage a decent return of the downside if the range style of trading has to continue. But, importantly, the lower range-line of $150 has to be wary of by the LTC/USD bears afterward.
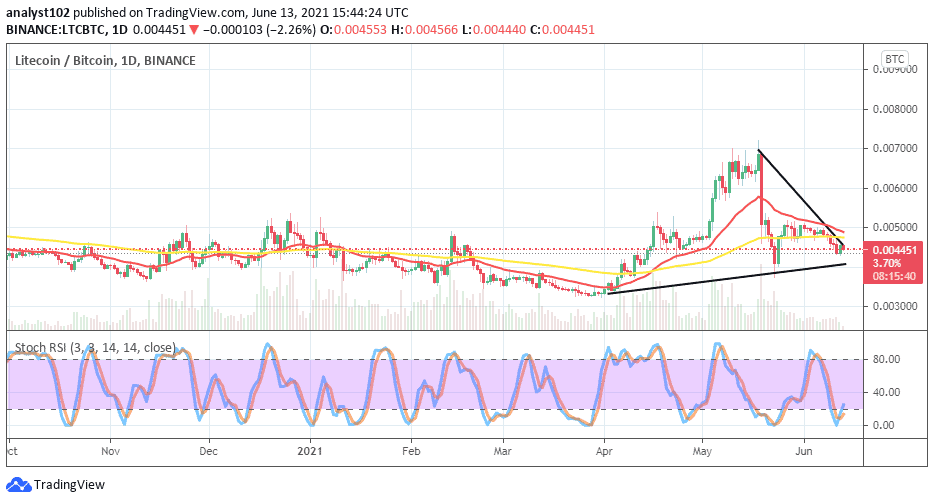
LTC/BTC Price Analysis
To some reasonable extent, as Litecoin’s value swings lower pairing with Bitcoin, the trend still seems in the favor of the base trading instrument. The bullish trend-line drew happens to be the only self-inclined technical tool that depicts that on the price analysis chart presently. The 50-day SMA indicator has breached to the south as the 14-day SMA trend-line is closely located above. The Stochastic Oscillators are dipped into the oversold region with slightly crossed lines pointing toward the north at range 20. That indicates that an upward swing is in the womb of time to be on the side of the base crypto coin against the flagship counter cryptocurrency.
Looking to buy or trade Bitcoin (BTC) now? Invest at eToro!
75% of retail investor accounts lose money when trading CFDs with this provider
Credit: Source link


