Litecoin Price Trades Undervalued of $200 – August 22
The LTC/USD financial book of records now has it that the crypto’s price trades undervalued $200 with a long-featuring of operations close below the point. The crypto’s percentage rate is at 4.68, trading around $188 level as of writing. That probably signifies that there is something in the hiding to favor an upward motion afterward.
Price Trades Undervalued of $200: LTC Trade
Key Levels:
Resistance levels: $200, $240, $280
Support levels: $160, $140, $120
The daily chart shows that the LTC/USD price trades undervalued $200 over a couple of trading days’ sessions. It appears that a resistant trading line exists close below the point as the crypto market has been finding it difficult to breach past to the north. Presently, the Stochastic Oscillators have crossed the lines northbound between the ranges of 20 and 40, seemingly indicating a promissory posture that some degrees of upward pressures are imminent. The 14-day SMA trend-line has moved northward to touch the 50-day SMA trend-line from beneath. That also indicates that some buying forces are still somewhat prevailing in the market.
Even if it eventually happens that $200 breaches northwardly, could the market sustain it as price trades undervalued it over a time now?
A long bullish candlestick tends to form against the $200 may allow the settling of new higher trading zones as the LTC/USD price trades undervalued the point. The rejection or consolidation of price movement around the line won’t be okay for the crypto’s smooth upward motion. Going by the current appearance of today’s candlestick, hope is on a higher note that bulls may push northward furthermore away from the current trading point stipulated in the first paragraph.
On the downside, in the first place, the current readings of the Stochastic Oscillators suggest that much is expected of the crypto market bulls to push for more ups, especially against the line at $200. However, in the process of that assumption forthcoming, any sign of active price reversal in the presumed northward motion between that point and a higher resistance line may give a clue to getting a sell entry. Traders needed to take to trading principles while exerting shorting positions of the crypto operations in the present cycle of trending.
LTC/BTC Price Analysis
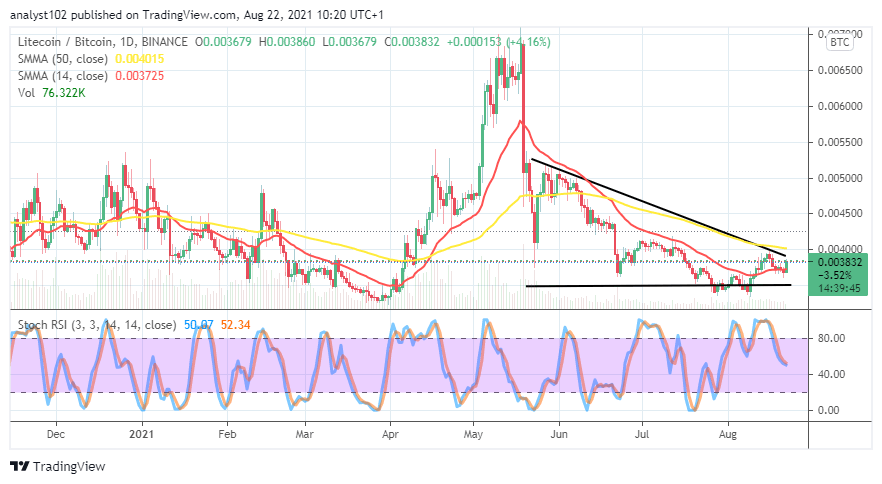
In comparison, today’s session, as of writing, shows a bullish candlestick in the making that the LTC/BTC price trades undervalued below the trend-line of the bigger SMA. That showcases that the base crypto appears, getting set to push against the trending capacity of the counter crypto. The bearish trend-line drew alongside the 50-day SMA indicator above the 14-day SMA indicator. The Stochastic Oscillators have moved southbound from the overbought region. They now try to cross the lines up near above the range of 40. That signifies that Litecoin is presently striving to push against Bitcoin.
Looking to buy or trade Litecoin (LTC) now? Invest at eToro!
75% of retail investor accounts lose money when trading CFDs with this provider.
Credit: Source link


