Litecoin Price Dumps Closer to $100– January 22
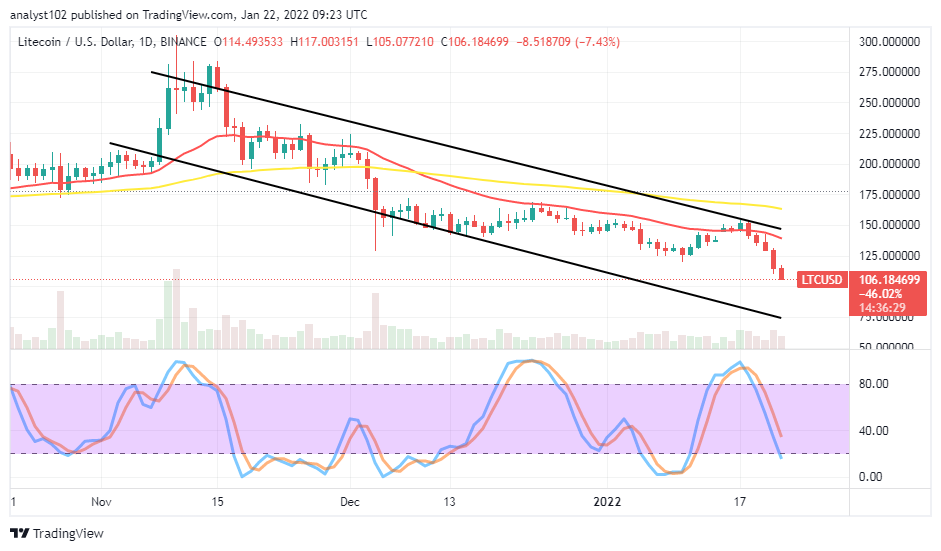
There has been a heavy declining-moving nature in the LTC/USD market activities as the crypto-economic price slumps closer to the $100 line. The market, as of writing, has been trading between the high of about $117 and $105 lines. The crypto keeps a percentage rate of about 7.43 negatives.
Litecoin Price Dumps Closer to $100: LTC Trade
Key Levels:
Resistance levels: $120, $130, $140
Support levels: $100, $90, $80
LTC/USD – Daily Chart
The LTC/USD daily chart showcases the crypto-economic price slumps closer to $100. The downward force has been immersive, able to breach the $125 level to the downside in the bearish channel trend lines. The 50-day SMA indicator is underneath the 14-day SMA indicator. The Stochastic Oscillators have moved southbound slightly past the range of 20 into the oversold region. The downward force is prevailing in the market at the expense of bulls’ weaknesses to push back northward presently.
Will the LTC/USD market fall more as the crypto-economic price slumps closer to $100?
There may still be more downward motions, stagging against the LTC/USD trade at the $100 as the crypto-economic price slumps closer to the value line. A quick-rebounding moving effort is to resurface beneath the value line to set back the market on a recovery mode potentiality in no time. Therefore, the long-position takers may have to stay alert when that presumed scenario tends before deciding to go for a long position order.
On the downside of the technical analysis, the LTC/USD market short-position takers may now have their capacity mustered beneath the $125 trading level to keep a long dominance in the crypto business operations. Consolidation of the bears’ efforts around the value line mentioned will allow the market to get more advantages of forcing the price further to a lower trading spot in the long run.
LTC/BTC Price Analysis
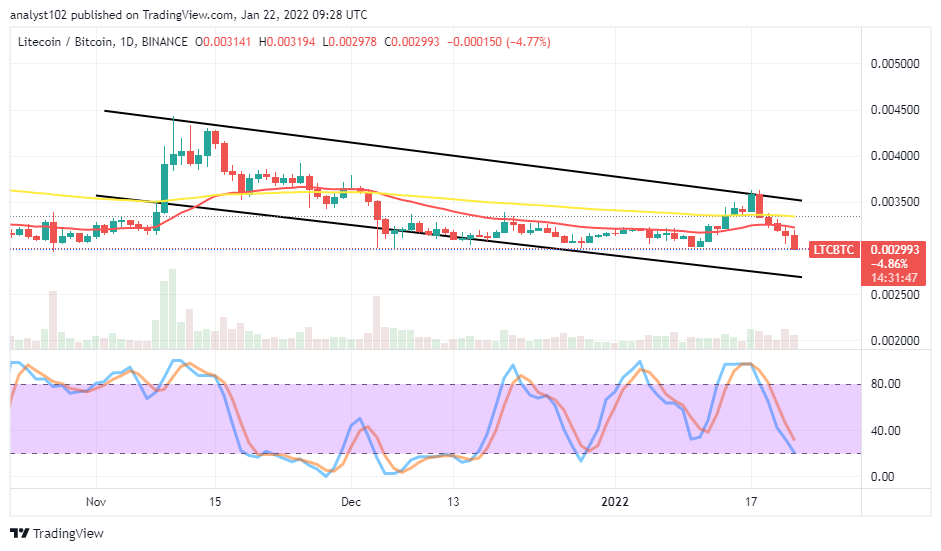
In comparison, Litecoin has been downsizing in its trending capability as paired with Bitcoin. The cryptocurrency pair price slumps southward beneath the trend lines of the SMAs. The 50-day SMA indicator is above the 14-day SMA indicator. The Stochastic oscillators are down close to the range of 20, indicating the possibility of getting to see the base crypto on the verge of losing more momentums to the chieftain counter crypto in the subsequent sessions.
Looking to buy or trade Bitcoin (BTC) now? Invest at eToro!
68% of retail investor accounts lose money when trading CFDs with this provider.

Read more:
Credit: Source link


