Litecoin Price Dumps in $150 and $100 – June 27
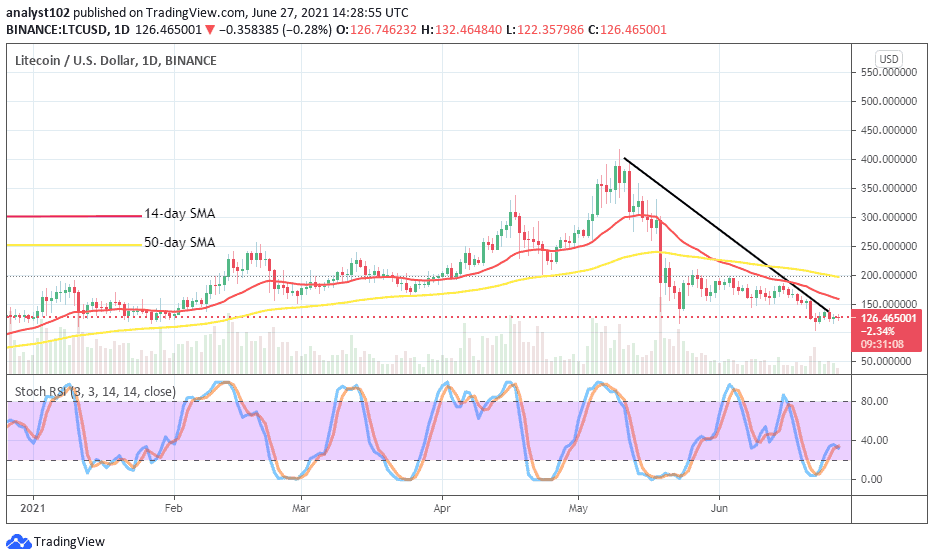
The market trading situation of LTC/USD still shows that the crypto’s price dumps in between the levels of $150 and $100 to trade around the value of $126 as of writing. The market’s percentage rate is at about 0.05 percent.
Price Dumps in $150 and $100: LTC Market
Key Levels:
Resistance levels: $150, $200, $250
Support levels: $100, $900, $80
The LTC/USD daily chart reveals that the crypto’s worth is still somewhat depressed by the US fiat currency as price dumps to trade within the values of $150 and $100. The downward trend is slightly increasing as the SMAs are bending southward further against the resistance lines to attest to the firmness of the declining force in the market. The 50-day SMA is located over the 14-day SMA trend-line as the bearish trend-line remains drawn across them to get placed underneath them. The Stochastic Oscillators have sprung northbound from the oversold region. They now seemingly attempt trying to close the lines near range 40 to possibly portend a re-surface of a declining force in the crypto trade.
Would there be a further breakdown in the LTC/USD market as price dumps in $150 and $100 levels?
The present decline force in the market operation that pairs Litecoin with the US Dollar doesn’t seem to support price dumps further to break down below the smaller level at $100 in the near session. On June 21, the market fell from $150 to trade in a range-bound style a bit above the point of $100 A trading indicator has portended that a declining force may still feature in the market to get a push down to revisit a lower point.
The main barrier trading line has been observed at the level of $150. And, that point would be the trading zone where bears may be posting a decent retardation position while price tends to stop dumping further southward at a later time. A slight forceful decline force against the point of $100 may most likely see a line of price convergences a bit below it which could in no time give way back to an upswing.
LTC/BTC Price Analysis
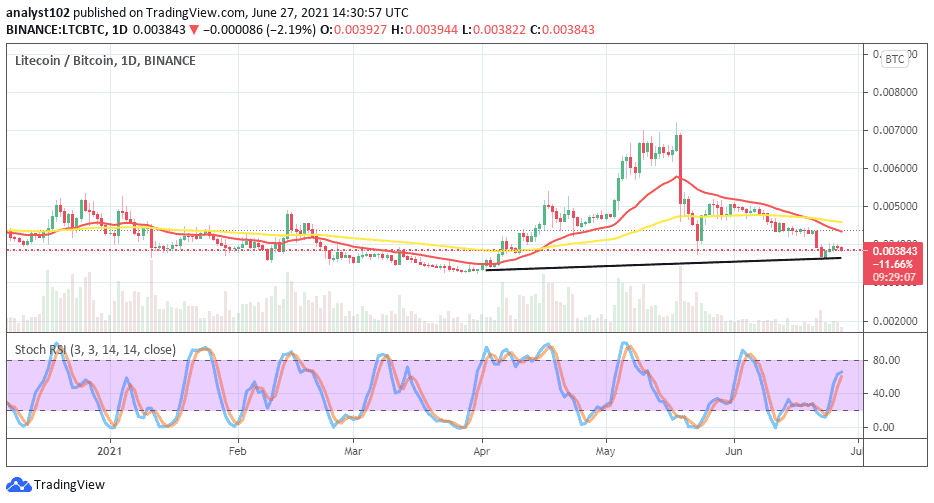
There has been a continual loss of trending capacity by Litecoin as it pairs with Bitcoin in comparison. Until the present trending outlook, the base crypto’s price dumps more slightly. The SMAs are over the trending spot of the pairing cryptos. The 50-day SMA indicator is over the 14-day SMA trend-line. The Stochastic Oscillators have swerved northbound closely below range 80 in an attempt to close the lines That could lead to seeing the base tool being overwhelmed again by the counter-trading instrument.
Looking to buy or trade Litecoin (LTC) now? Invest at eToro!
75% of retail investor accounts lose money when trading CFDs with this provider
Remember, all trading carries risk. Past performance is no guarantee of future results.
Credit: Source link


