Litecoin Averages $200 Resistance – May 31
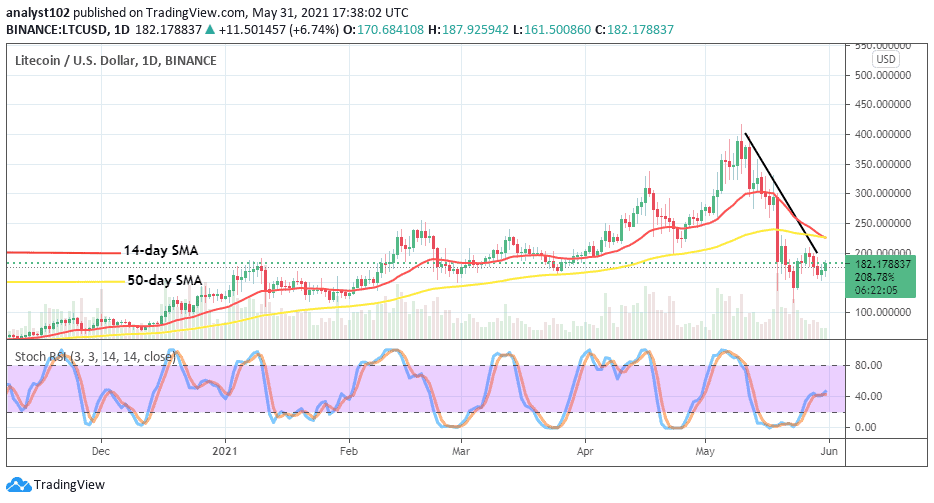
The present LTC/USD trading outlook suggests that the crypto’s price averages $200 resistance line after making a slight reversal from a lower point. As of writing, the market witnesses a 6.82% increment to trade around the value of $183.
Averages $200 Resistance: LTC Market
Key Levels:
Resistance levels: $200, $250, $300
Support levels: $150, $1300, $110
LTC/USD – Daily Chart
It is currently depicted on the LTC/USD daily chart that the crypto market averages $200 resistance level. The 14-day SMA trend-line has moved southward from a high point to touch the 50-day SMA indicator at a lower area as the bearish trend-line remains drawn down across them to place a mark on the immediate $200 resistance level as an important line. The Stochastic Oscillators are around range 40 trying to open the hairs toward the north. That indicates the possibility of getting to see an upward move very soon in the crypto market.
As Litecoin averages a $200 resistance level, will be able to sustain beyond it?
A violent breakout is most needed as Litecoin versus the US Dollar’s market averages a $200 resistance level to be able to sustain beyond it. But, the kind of upside pressure being exhibited by the LTC/USD bulls isn’t suggesting sufficient safe trading status for bullish trend sustainability in the near time. As a result, more time of energy mustering is required by bulls around or even below the market point earlier mentioned.
The mid-point of $200 and $250 now appears to be the important price level that bears need to be on the lookout for as price’s tendency of reversing in those points is higher than making a smooth northward running afterward. A successful interception of the bigger SMA by the smaller SMA from the top will signal a return of some falling forces to feature for a sizeable number of days’ trading activities. 
LTC/BTC Price Analysis
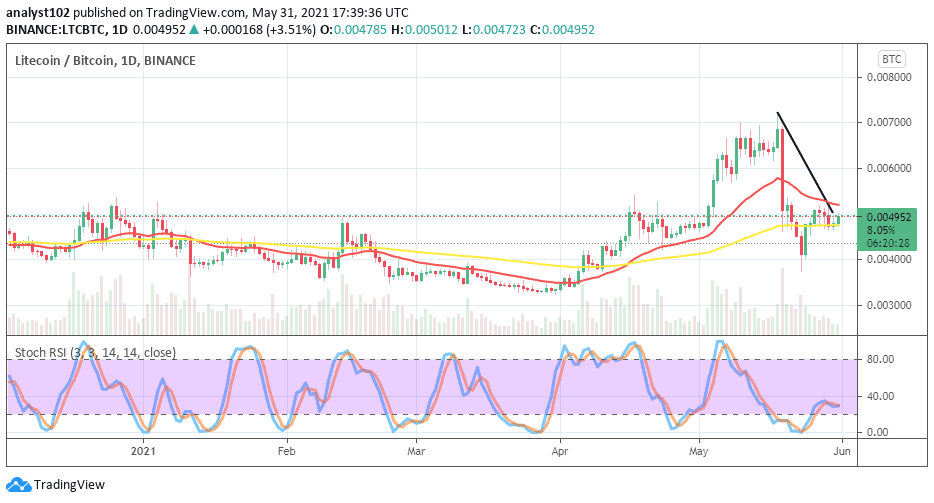
Comparing the trending weight that now exists between Litecoin and Bitcoin, the trading chart depicts that the base crypto is trying to regain its recently lost momentum as paired with the counter instrument. Variant candlesticks have converged in the space between the two SMAs. The 50-day SMA indicator is located underneath the 14-day SMA trend-line. And, the bearish trend-line drew briefly across the smaller SMA trend-line to locate a key line demarcating the trend lines of the SMAs. The Stochastic Oscillators have conjoined the hairs to slightly bend toward the south in ranges of 20 and 40. That indicates the possibility of getting to see less active pushes in the market as at the time of writing.
Remember, all trading carries risk. Past performance is no guarantee of future results.
Credit: Source link


