Litecoin Price Keeps Position Close to $150 Level – June 30
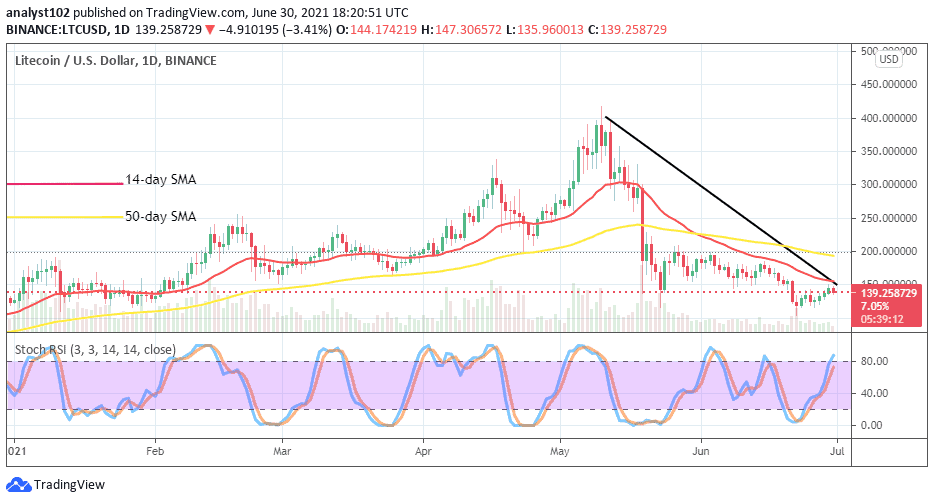
The LTC/USD market keeps its position close to $150 after a smaller line of successive upswings. The market’s worth now trades around the value of 139 at a percentage rate of about -3.34.
Price Keeps Position Close to $150 Level: LTC Market
Key Levels:
Resistance levels: $180, $230, $280
Support levels: $110, $100, $90
On the LTC/USD daily chart, the crypto economy now keeps its position closer to the value of $150. The bearish trend-line drew downward across the bigger SMA to join the smaller SMA at the market’s point earlier mentioned. The 50-day SMA indicator is located over the 14-day SMA trend-line. The Stochastic Oscillators have briefly swerved the blue line into the overbought region. That signals a less impulsive motion in the recent notable rebounding movement of the crypto market.
Will there be a breakout at the level of $150 as the LTC/USD market keeps its position close to it?
It now appears that there is no stronger signal backing the breakout of the level of $150 as the LTC/USD market keeps its position close to it. A line of variant barriers is built up around that point so that price could see resistance. The market may also start a range-bound moving style around the level in no time. In the meantime, what is technically accepted is that points underneath the trade level earlier mentioned are the support base zones that bulls may reliably get buying entries while price pushes downward.
As to the downside of this crypto economy, bears needed to heighten pressures around the level of $150 in the subsequent trading days’ sessions. The pathway to the south following the current bearish trend lies around the point. A sudden hike at that point may potentially invalidate the trading psyche of getting a return of downward motion. Therefore, bears should be cautious of exerting a sell order now in the market.
LTC/BTC Price Analysis
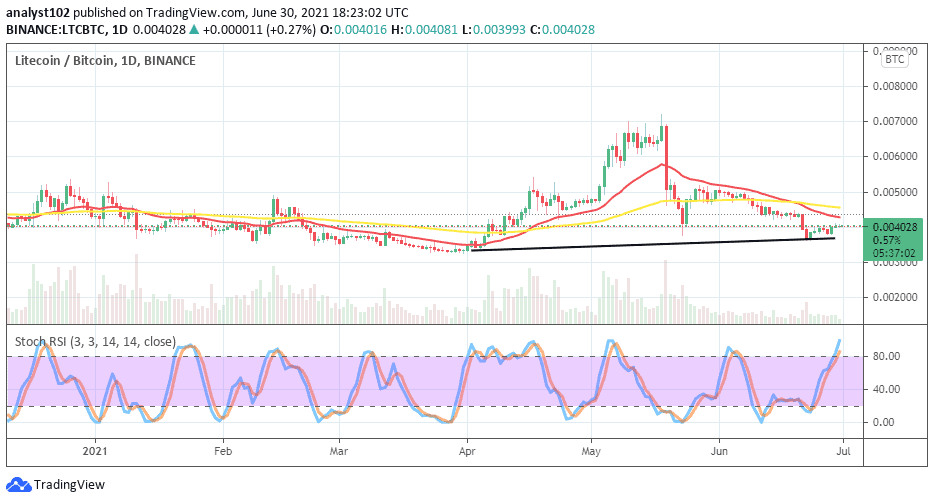
The trending capability of Litecoin as compared with that of Bitcoin appears to be in a motion of gradual recovery. The base crypto keeps its position close to the smaller SMA from underneath. The 50-day SMA indicator is above the 14-day SMA trend-line. The Stochastic Oscillators have freshly moved into the overbought region to suggest that the base instrument is on the verge of relaxing in its active movement to the north.
Looking to buy or trade Litecoin (LTC) now? Invest at eToro!
75% of retail investor accounts lose money when trading CFDs with this provider
Remember, all trading carries risk. Past performance is no guarantee of future results.
Credit: Source link


