Litecoin Fluctuates in Range Zones – June 9
The LTC/USD worth now fluctuates in range zones of $200 and $150 after making a failing attempt to push down past the lower range value of the market. The crypto market’s price is now seen trading around the level of $158 not being too far from the lower range-bound zone. As of writing, the financial percentage rate of the trade stands at about a reduction of -2.12.
Market Fluctuates in Range Zones: LTC Market
Key Levels:
Resistance levels: $200, $250, $300
Support levels: $130, $1200, $110
LTC/USD – Daily Chart
Today’s session has seen a very tiny candlestick in the range-bound zones very to the lower point. As a result, it is still somewhat depicted on the LTC/USD daily chart that the range-bound zones will have to hold until some other next sessions as the two major movers are seemingly not making their impact strong on the market. The bearish trend-line drew southward across the SMA trend lines to place a mark near above the level of $150 to indicate the degree at the market valuation is. The 50-day SMA indicator is located over the 14-day SMA trend-line. The Stochastic Oscillators have moved down from the overbought region to point toward the south very lightly past range 20. That still suggests that a relative amount of selling pressure is ongoing in the market.
What direction the LTC/USD price fluctuations in range-bound zones lead into?
As regards the LTC/USD price fluctuation in the range–bound zones, bulls may have to patiently wait for a rebound from a lowly point of the lower range-line for a decent buy entry. The downward moving past of the $200 resistance level by the 14-day SMA will possibly allow price to push more for a quick revisit-trading situation of some lower values.
Analyzing the downside of this market, the eventual breaking down of the lower range-bound line of $150 is still scary as to whether a downward push past it could be sustainable in the long run. It could only be a good trading condition for bears to consolidate their presence at the zone strongly against any attempting upward motion that could in the process signal an end to getting to see more downs in a continuation moving spirit.
Looking to buy or trade Litecoin (LTC) now? Invest at eToro!
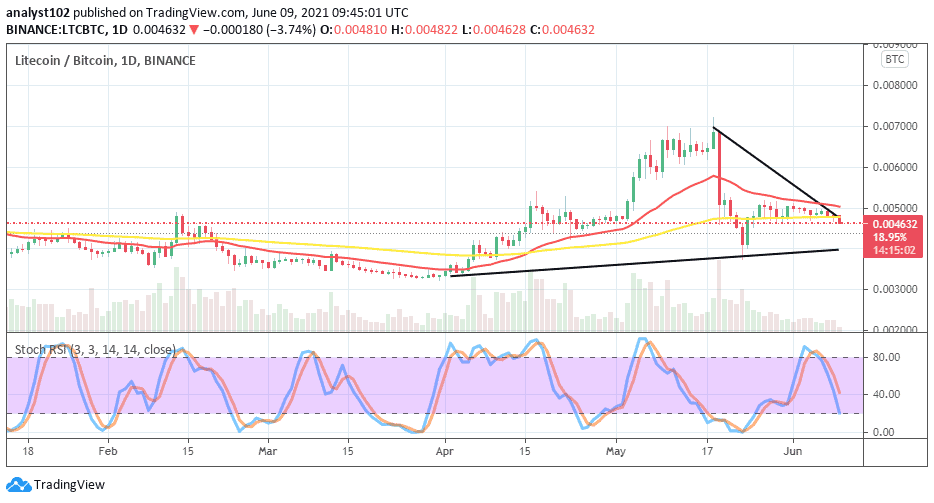
LTC/BTC Price Analysis
Taking a deep look at the trending outlook that exists between Litecoin and Bitcoin, the base crypto possesses a weightier stance pairing with the counter crypto to some extent as it is depicted on the price analysis chart. But, in the meantime, the base crypto seems to succumb to a force by the counter instrument as a movement is being made currently in the market to push southward out of range-bound zones that have existed at a higher considerable level. The 14-day SMA trend-line is closely located above the 50-day SMA indicator. And, they still both point toward the east direction. The stochastic Oscillator slightly point toward the south to keep a warning signal possibly against seeing LTC pushing with ease as paired with BTC as of writing.
75% of retail investor accounts lose money when trading CFDs with this provider
Credit: Source link


