Litecoin Market Dares Breaking Lower – June 8
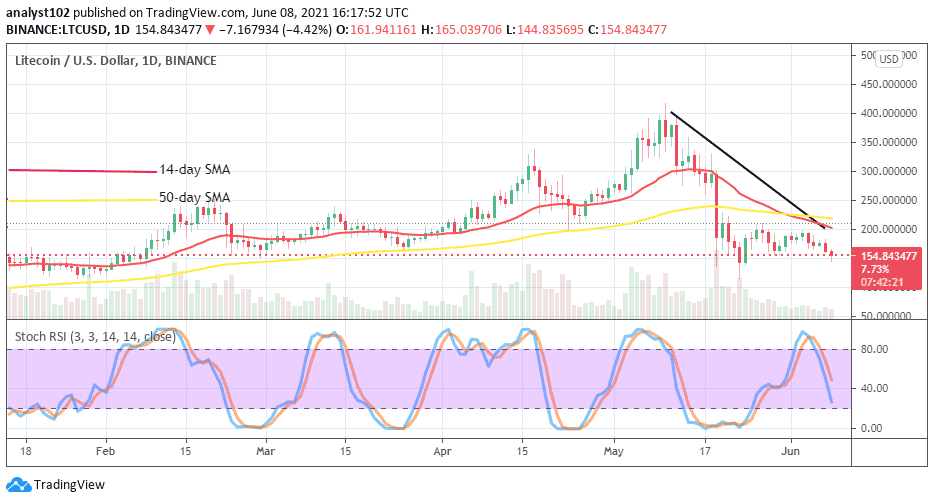
It is currently observed at a closer viewing point that the LTC/USD market dares breaking lower the range-line as the price has been fluctuating around the value of 155 at a rate of -4.24 percent.
Market Dares Breaking Lower: LTC Market
Key Levels:
Resistance levels: $200, $250, $300
Support levels: $120, $110, $100
LTC/USD – Daily Chart
Today’s trading session as depicted on the LTC/USD daily chart that price dares now dares breaking lower range-line as the level of $150 has briefly traded past to the south initially. A bearish candlestick is in the forming motion. The 50-day SMA indicator SMA has been intercepted from the top by the 14-day SMA trend-line as the bearish remains crossed downward against the SMAs’. The Stochastic Oscillators have crossed the lines from the overbought region to point southbound briefly past range 40 suggesting a downside pressure is the offing.
Breaking lower past the range-line, will the ETH/USD market see a huge drawdown?
Breaking lower past the range-line, it has now been noticed by ongoing selling pressure in the ETH/USD economy that a southward move Is imminent in the near session. A sudden pull-up from the lower range point of $150 will most likely push back the market into another trial trading situation of a bullish trend returning. However, if such a presumed scenario doesn’t have a volatile move, the range-bound may tend to continue.
As both the bearish and the 14-day SMA trend lines remain placed at the immediate resistance and the upper range-line of $200 below the 50-day SMA indicator portends that some degree of downward pressure is still somewhat in the market operations. Bears ought to have taken the advantage of the situation to have placed a sell order around the upper range-line. But, they now have to be wary of their position around the lower range-line.
Looking to buy or trade Litecoin (LTC) now? Invest at eToro!
LTC/BTC Price Analysis
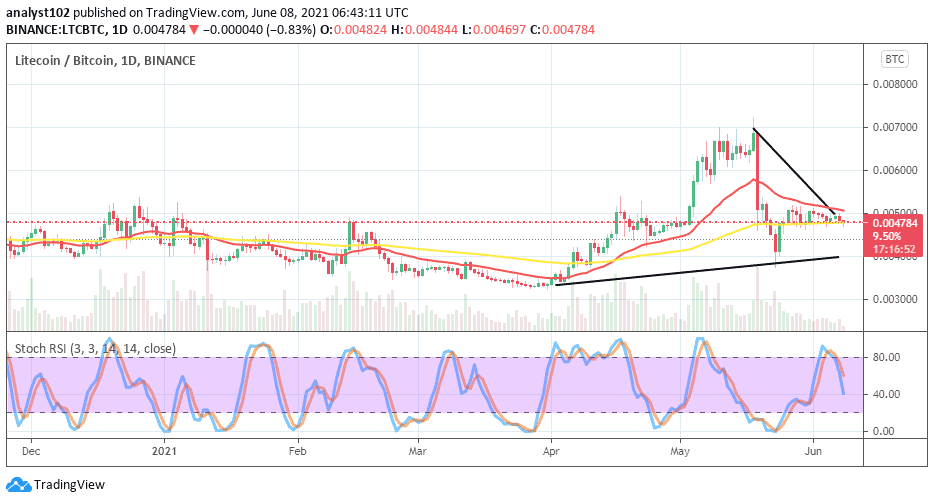
Comparing the market moving-capacity between Litecoin and Bitcoin, the base crypto yet possesses a higher length as paired with the most valuable counter crypto to some extent. A line of variant higher lows is kept occurring on the buy signal side of the bigger SMA indicator. The 14-day SMA and the 50-day SMA trend lines are pointing toward the east direction to validate an ongoing range trading outlook of the cryptos. The Stochastic Oscillators have slightly crossed downward from the overbought region to point to the south near over range 40. Going by that, the base crypto is on the verge of breaking the lower range zone as placed against the counter cryptocurrency.
75% of retail investor accounts lose money when trading CFDs with this provider
Remember, all trading carries risk. Past performance is no guarantee of future results.
Credit: Source link


