Bitcoin fell as low as $15,500 on Nov. 21, marking a 106-week low for the leading cryptocurrency.
Market sentiment remains fragile as anger over the FTX fiasco turns to acceptance, and the magnitude of what happened finally sinks in. Worse still, the full extent of the black hole is not known at this time.
While several crypto exchanges scrambled to evidence solvency as a result of the FTX fallout, contagion risk continues to weigh heavily.
The Crypto Fear & Greed Index currently reads 22 – extreme fear. Strangely, this compares relatively favorably versus the Terra implosion in June which saw a reading of 6 at peak fear.
On-chain Glassnode data analyzed by CryptoSlate revealed, despite contagion fears, Long-Term Holders (LTHs) are continuing to accumulate, even despite a significant proportion who are nursing losses.
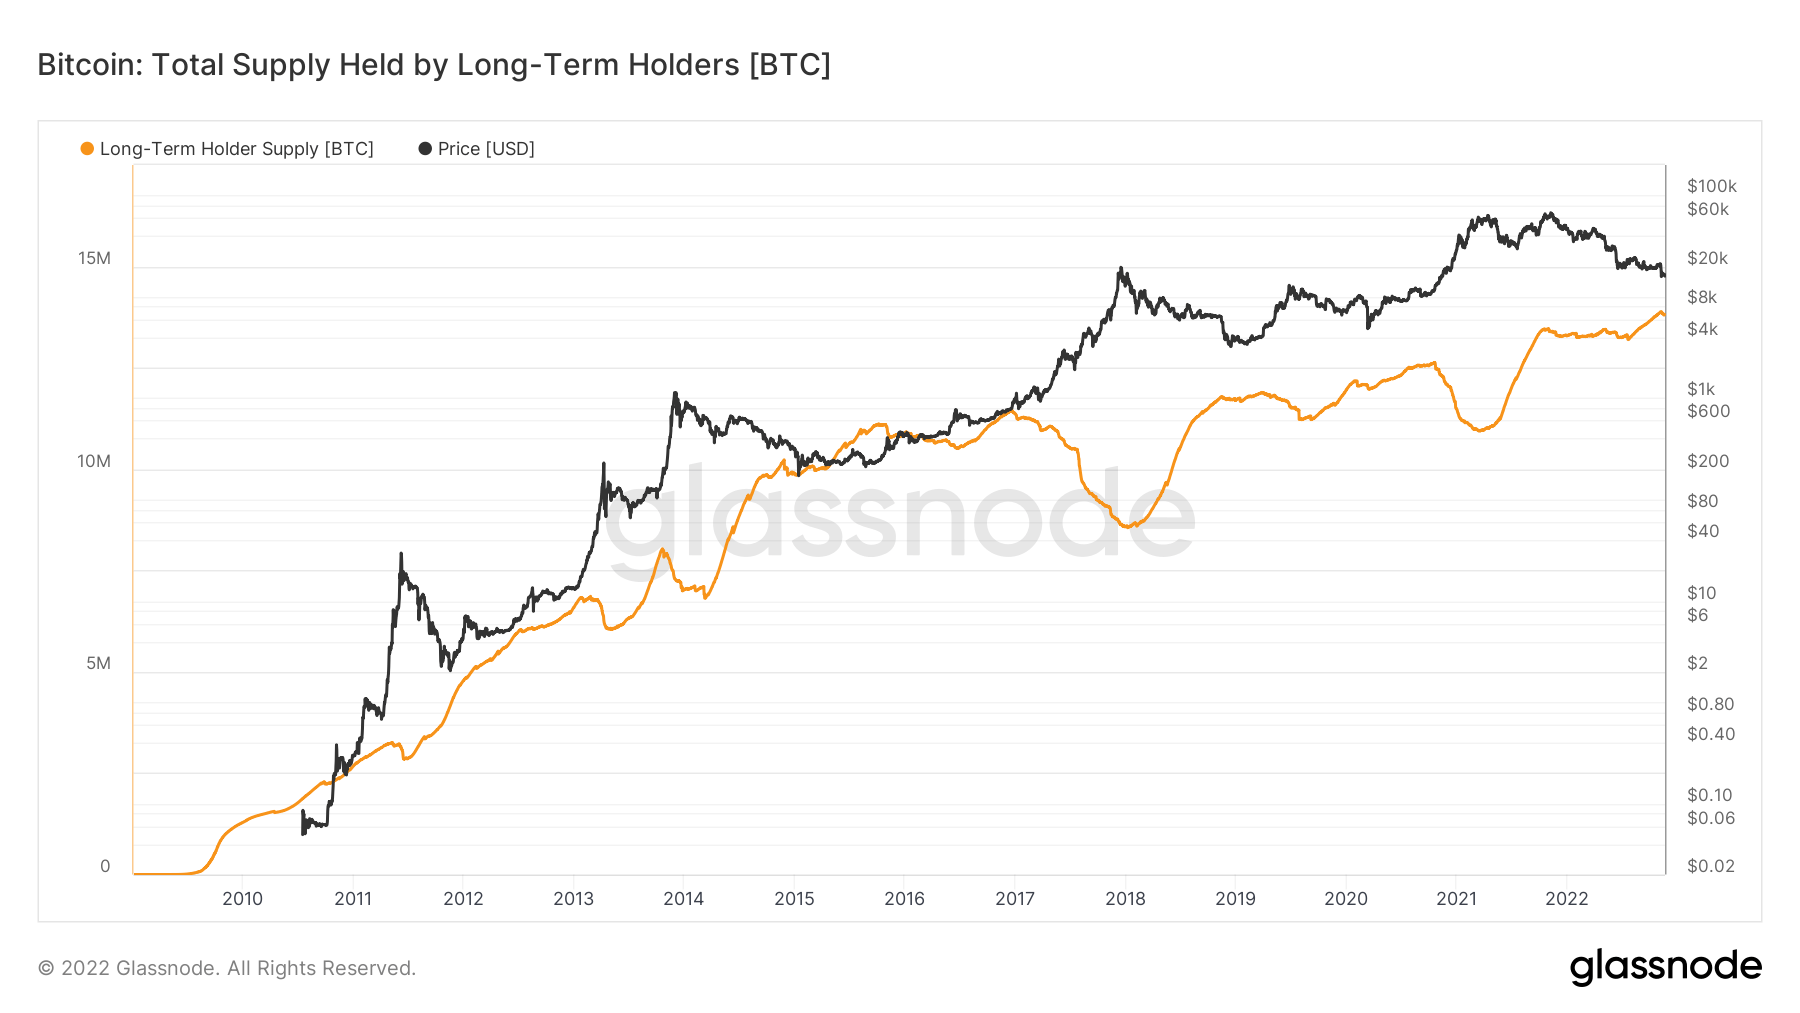
Bitcoin: Total Supply Held by Long-Term Holders
The Total Supply Held by Long-Term Holders (TSHLTH) refers to BTC held for longer than six months. Tokens that reach this time threshold are generally considered dormant and are unlikely to be spent.
By contrast, Short-Term Holders (STHs) generally refer to new investors with “weak hands” and are more likely to exit the market in times of price volatility.
The chart below shows LTHs accumulating during times of price suppression while selling during bull runs. The TSHLTH currently reads 13.8 million BTC – an all-time high. This represents about 72% of the circulating supply.
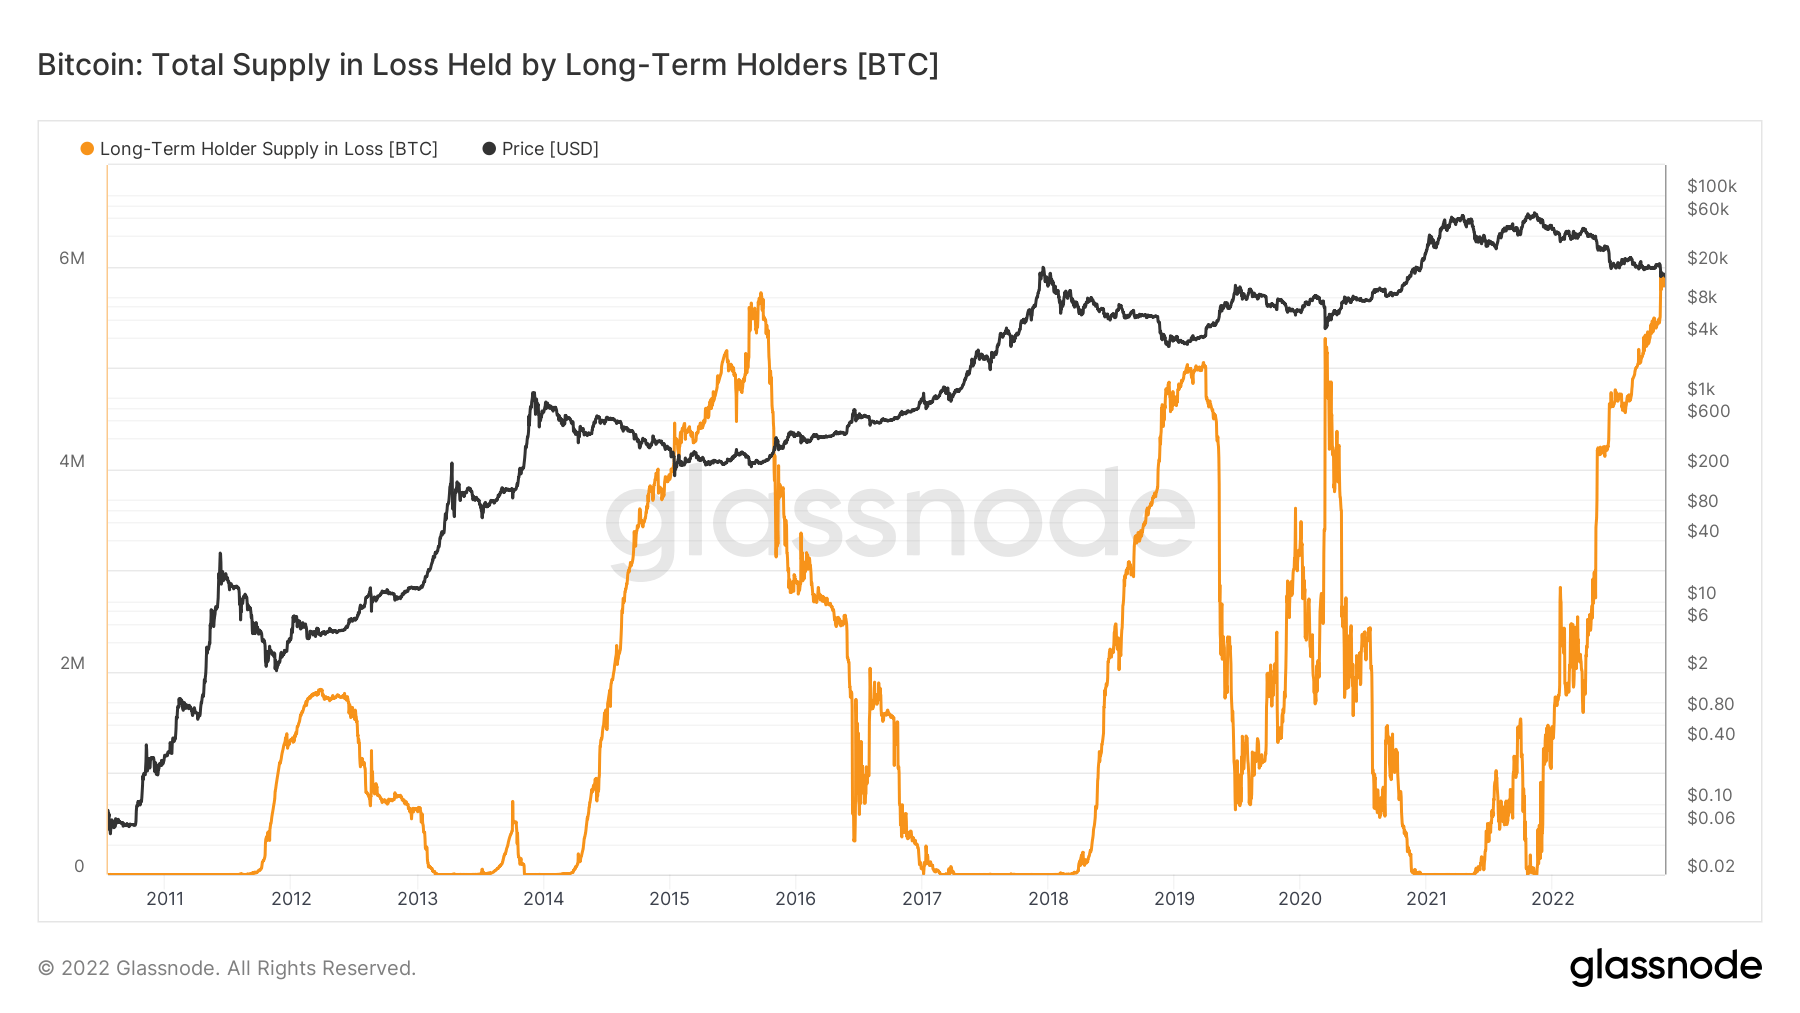
Total Supply in Loss Held by Long-Term Holders
LTHs are considered smart money, in that they tend to move in accordance with logic and reason rather than emotion.
The chart below shows approximately 6 million coins held by LTHs are at a loss. Although this pattern fits with bear market bottoms in 2015, 2019, and 2020, this is the highest amount to date.
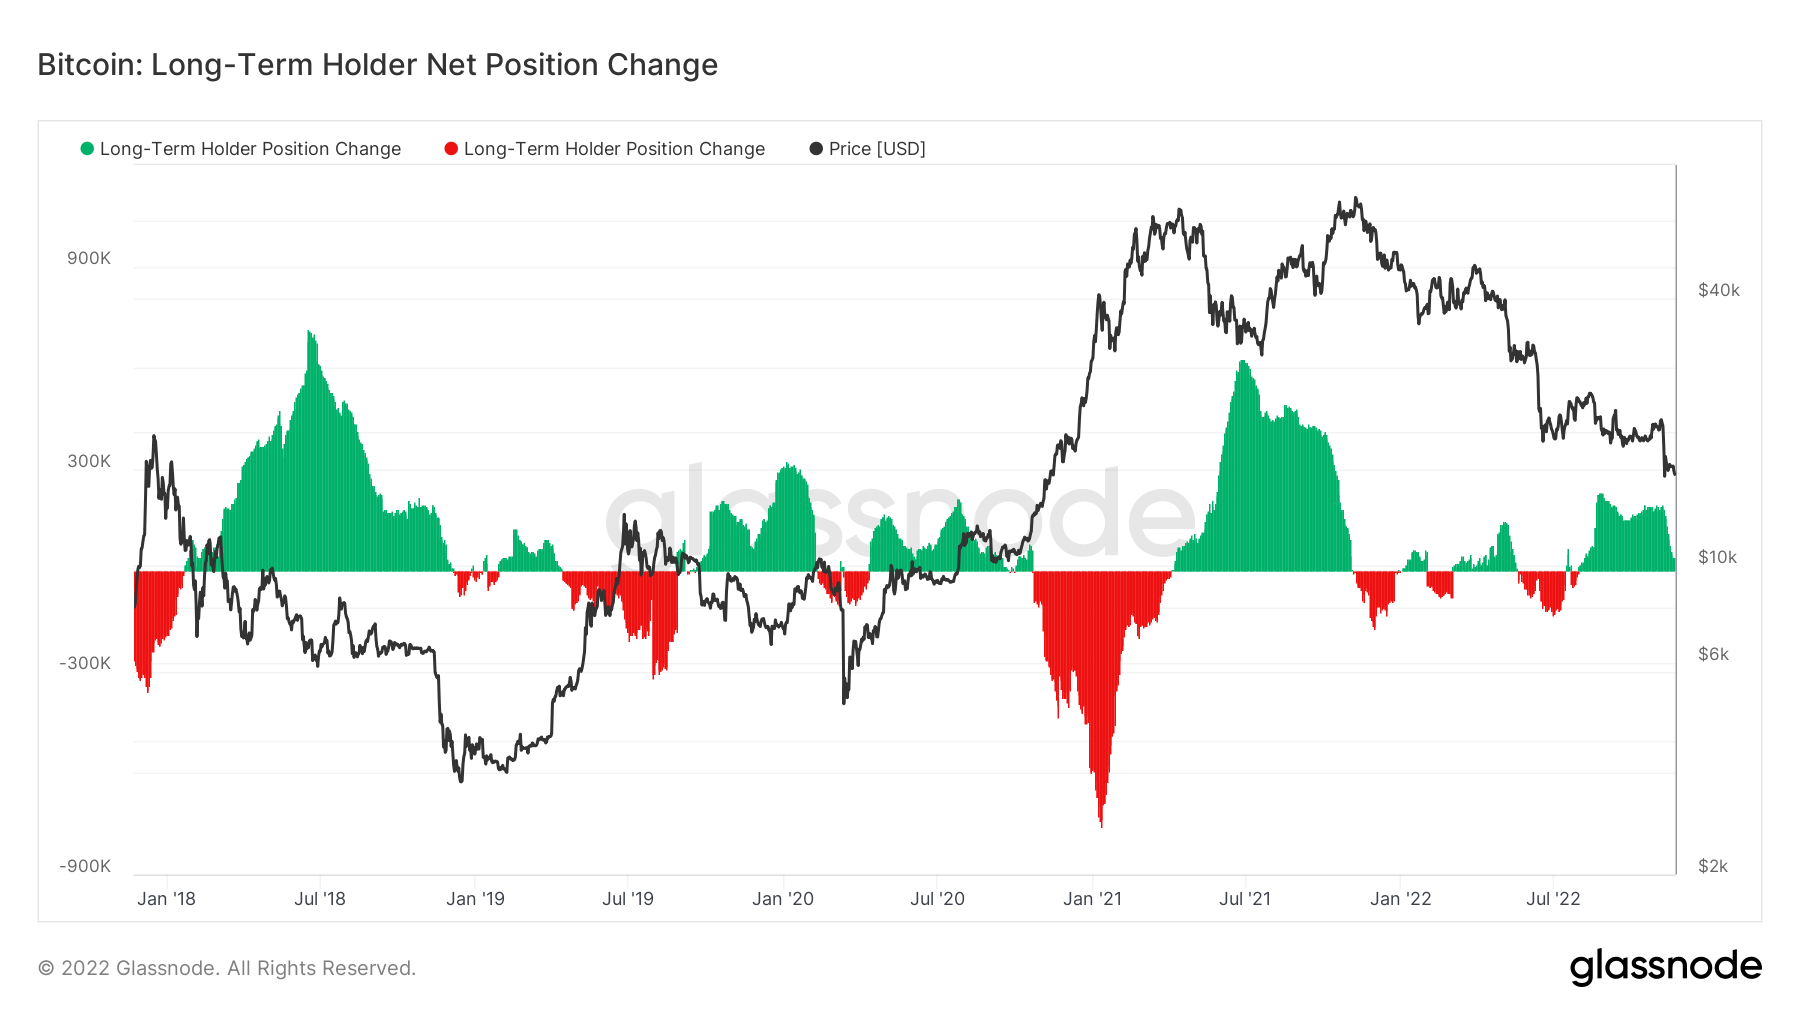
Long-Term Position Net Change Position
Net Change Position (NCP) refers to the net amount of Bitcoin entering or exiting exchange wallets.
The chart below shows LTHs are currently net accumulating at the highest rate in 2022. Although H1 saw NCP flipping between accumulation and distribution, H2 is largely characterized by net accumulation. This trend is interpreted as bullish, in that LTHs continue to keep the faith and are willing to buy, even in fearful market conditions.
Supply in Profit/Loss
Analyzing LTHs in profit and loss reveals 50% of LTHs are in profit at the current price, while 33% are running at a loss.
Compared to previous bear markets, this counts as one of the highest discrepancies, with the 2015 bear market a notable contender.
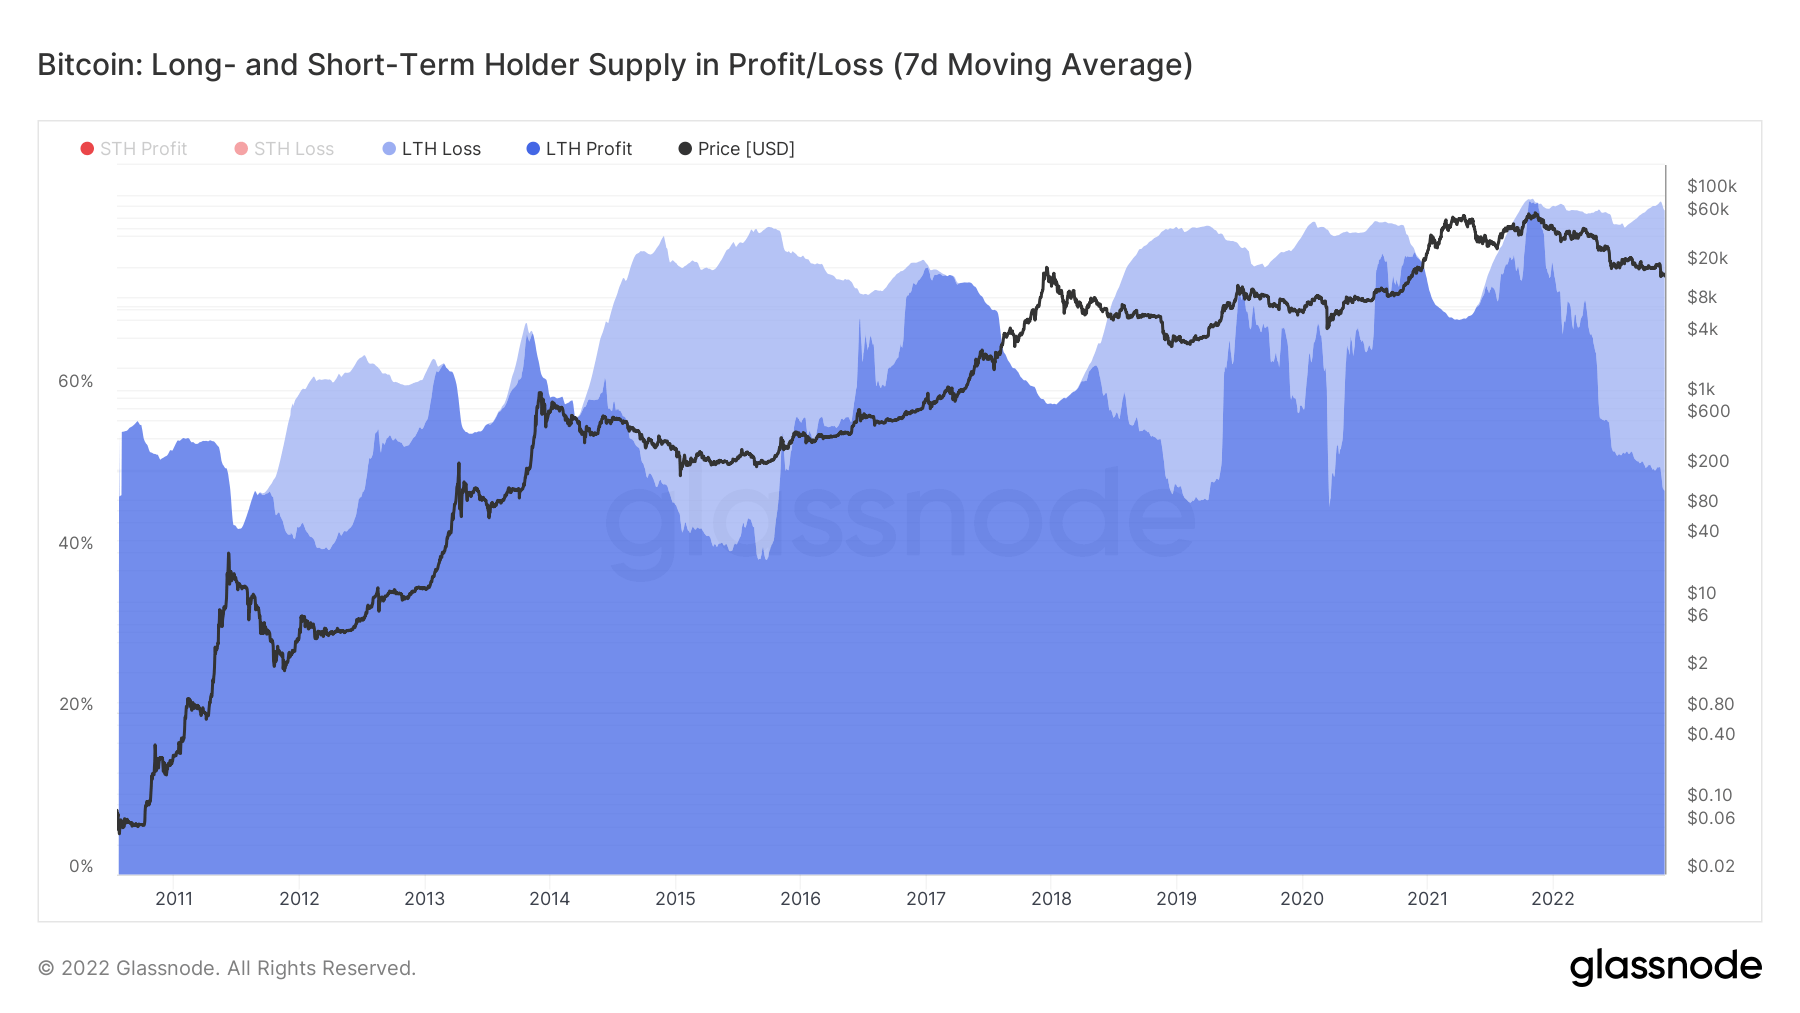
Typically, a new cycle of trend reversal follows capitulation. But the above data shows LTHs have yet to lose hope and capitulate at the current price.
Credit: Source link


