Litecoin Market Valuation Ranges– June 6
There have been different low price movements in the LTC/USD trade activities over a certain period of sessions. The crypto market valuation ranges mostly underneath the value of $200 as price now fluctuates at about $177 at a percentage increase of around 2.70.
Market Valuation Ranges: LTC Market
Key Levels:
Resistance levels: $200, $250, $300
Support levels: $150, $1300, $110
LTC/USD – Daily Chart
It is depicted on the LTC/USD daily chart that there has to be a continual featuring of market valuation ranges characterized with variant smaller candlesticks. The points of the market range-lines are found at $200 and $150. All the trading tools are located close above the higher range level of the market. The bearish trend-line drew across the SMAs from the top at a tail end of their trend lines. The 50-day SMA indicator has been slightly intercepted to the south by the 14-day SMA trend-line. The Stochastic Oscillators have briefly crossed southbound from the overbought region against range 80 to signal a decline move which tends not to last longer in the market.
Will the next LTC/USD market operation still feature valuation ranges?
As long as the two range-line points of $200 and $150 remain un-breached either downward or upward, the Litecoin as paired with the US Dollar market valuation ranges will tend to continue indefinitely. In the event of that scenario happening as speculated, the market lower range-line will most likely serve as support where bulls’ expectation of building up energy is considered technically ideal.
Although the crossing of lines in the overbought region by the Stochastic Oscillators pointing toward the southbound signifies a downward move is in the offing. But, the outlook of the size of the candlestick to give the real price action aligning with that signal carries very little pressure. Hence, one of the reasons for having the market valuation ranges. A forceful breakdown of the lower line may see back price to locate support between $150 and $100 levels.

Looking to buy or trade Litecoin (LTC) now? Invest at eToro!
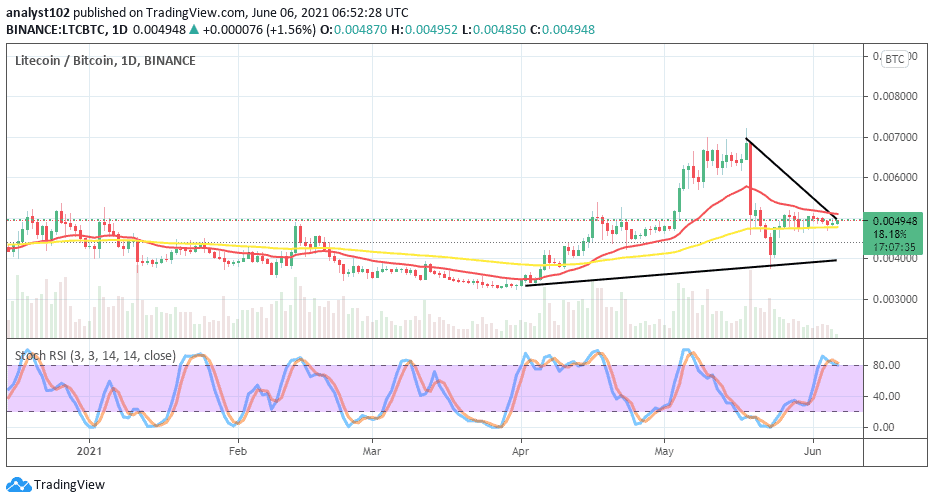
LTC/BTC Price Analysis
In comparison, it is showcased on the chart that the market moving capacity of Litecoin as paired with Bitcoin is now resorted to building up closely on the threshold of buy signal side of the bigger SMA indicator. The 14-day SMA trend-line is above the 50-day SMA indicator as they both point toward the east direction to attest to the current valuation ranges. The Stochastic Oscillators have crossed the lines slightly from the overbought region against range 80 to point southbound. A breakdown of the bigger SMA trend-line with an eventual interception of it by the smaller SMA trend-line may potentially lead the base crypto to look again for lower support. But, on the contrary, it appears difficult that the counter crypto will come up with such a strong reliable pushing catalyst against its base trading instrument in the near term
75% of retail investor accounts lose money when trading CFDs with this provider
Credit: Source link


