Litecoin Market Remains Declining – February 26
There have been lesser-active price motions in the LTC/USD trade operations as the crypto-economic market remains declining. The crypto economy versus the US Dollar business activities has recorded a high value of $114 and a low of $107 at an average minute negative percentage of 0.66.
Market Remains Declining: LTC Trade
Key Levels:
Resistance levels: $120, $130, $140
Support levels: $100, $90, $80
LTC/USD – Daily Chart
The LTC/USD daily chart showcases the crypto-economic market remains declining and has been unable to make any significant sign of staging a recovery move to push away from the $100 support baseline to the north side. The featuring outlook of descending triangle is still intact as the 14-day SMA indicator is underneath the 50-day SMA indicator over the candlesticks currently representing the trading level of the crypto economy. The Stochastic Oscillators have moved northbound out of the oversold region, somewhat slantingly pointing to the upside around the range of 20.
From the technical viewing point, is $125 the highest value that price can push as the LTC/USD market remains declining?
The $125 price level could be the highest psychological resistance line that price can push in the long run at the weakness of bears as the LTC/USD market remains declining. In the meantime, the situation lacks a significant sign of mustering forces to the upside. And if that persists for some more days, it can lead to a range-bound trading outlook around the $100 critical support baseline.
On the downside of the technical analysis, at this point, it would be advisable to stay clear of the market for a while until the situation changes when the Stochastic Oscillators move into the overbought region to portend a return of a downing mode for the market afterward. That can achieve by exercising patience. A breakdown at the $100 isn’t releasable in the near time. Therefore, short-position placers should be cautious of joining such a sudden move around the value line.
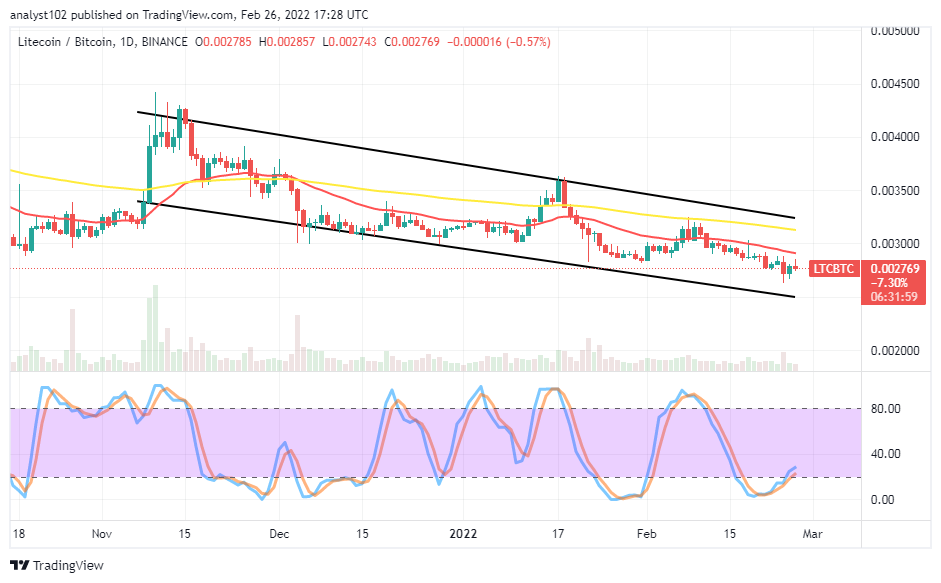
LTC/BTC Price Analysis
In comparison, Litecoin has been serially succumbing to a downward force inflicted on it by Bitcoin. In other words, the cryptocurrency pair market remains declining under the trend lines of the SMAs. The 50-day SMA indicator is above the 14-day SMA indicator. The Stochastic Oscillators have briefly crossed northbound from the oversold region against the range of 20. It seems that the base crypto may strive to push against the counter crypto for a short while in the next session.
Looking to buy or trade Bitcoin (BTC) now? Invest at eToro!

68% of retail investor accounts lose money when trading CFDs with this provider.
Read more:
Credit: Source link


