Litecoin Lowers Rallying Moves– May 30
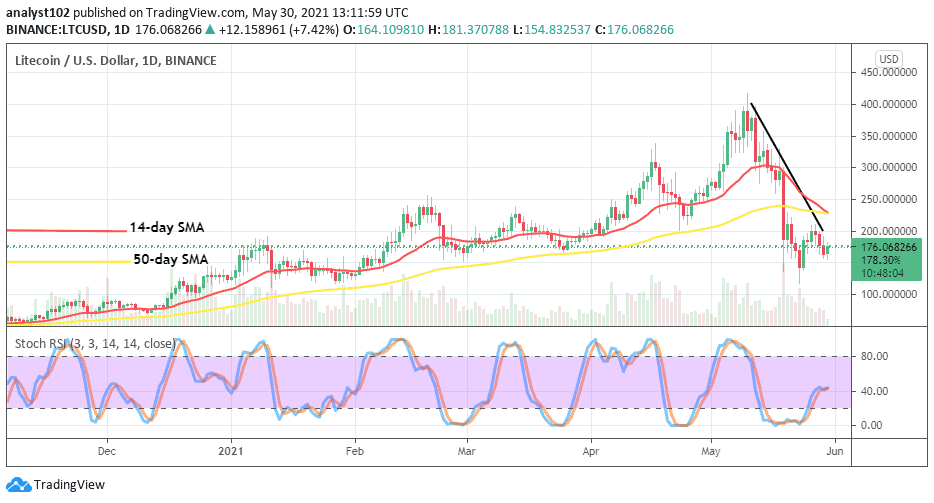
The recent uprising in the LTC/USD market now experiences price lowers rallying moves after the crypto lost momentum to surge past a resistance trading area of around $200. During the time of writing, the trading pair records about a 7.58% increase around the level of $176.
Begins a Rally: LTC Market
Key Levels:
Resistance levels: $200, $250, $300
Support levels: $140, $120, $100
LTC/USD – Daily Chart
About a few days’ sessions back, there has been a light-weighted line of price lowers rallying moves on the LTC/USD daily chart. The lowering movement began while the crypto’s price rallied to meet resistance around the value of $200 on May 27. The 14-day SMA trend-line has moved down to touch the 50-day SMA indicator a bit below the $250 market level. The bearish trend-line drew across them southward to locate the lower-key line at $200. The Stochastic Oscillators are at range 40 with closed hairs pointing towards the east direction. That suggests the possibility of getting to see a less-active price action very soon to play out in the market.
Litecoin price lowers rallying moves, is it going to feature long?
As Litecoin is presently experiencing price lowers rallying moves, the US Dollar as well doesn’t seem to exert more fearful depressions on the pace of the trading situation. That said, a strong regaining of strength could be witnessed by bulls between the lower point of $150 and the key upper line of $200 in no time. And, those points mentioned may also witness a line of range-bound trade movements while the two major market movers do not come up with more pushing pressures in the next trading session.
In continuation of a downturn movement of this crypto economy, bears have to keep on resisting any swing high in an attempt to break past the level of $200 to the north. However, the present trading point of around $176 may not be forcefully pushed further beyond the last previously achieved lower value nearing the support of $100 at a later period.
LTC/BTC Price Analysis
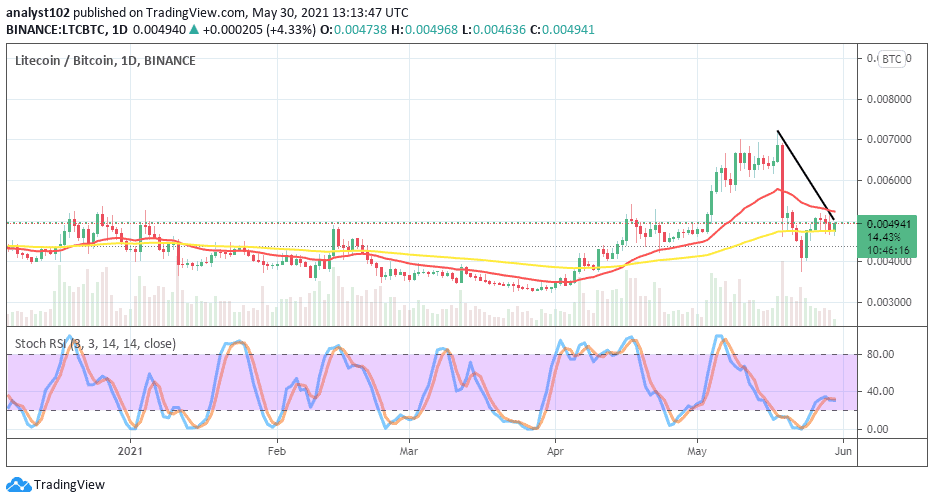
In comparison, the last downward pressures in the LTC/BTC price trending-weight have been noted not being far from the lower correctional trading point. Between May 25 and until now, the base crypto has pushed in a range-bound within the SMA trend-lines. The 14-day SMA trend-line has intercepted from the top by the bearish trend-line as the 50-day SMA indicator is placed underneath them. The Stochastic Oscillators have closed the hairs to indicate that the two cryptocurrencies pairing with each other are getting reduced in momentum in the market. That shows that an indecision trading situation is most likely tended to continue.
Remember, all trading carries risk. Past performance is no guarantee of future results.
Credit: Source link


