Litecoin Holds Position Dip – June 23
The trade worth of LTC/USD has continually traded with less-active moves underneath the resistance line of $150 as price holds a position dip to trade around the value of $128 at a percentage rate of 7.26.
Holds Position Dip: LTC Market
Key Levels:
Resistance levels: $150, $200, $250
Support levels: $110, $100, $90
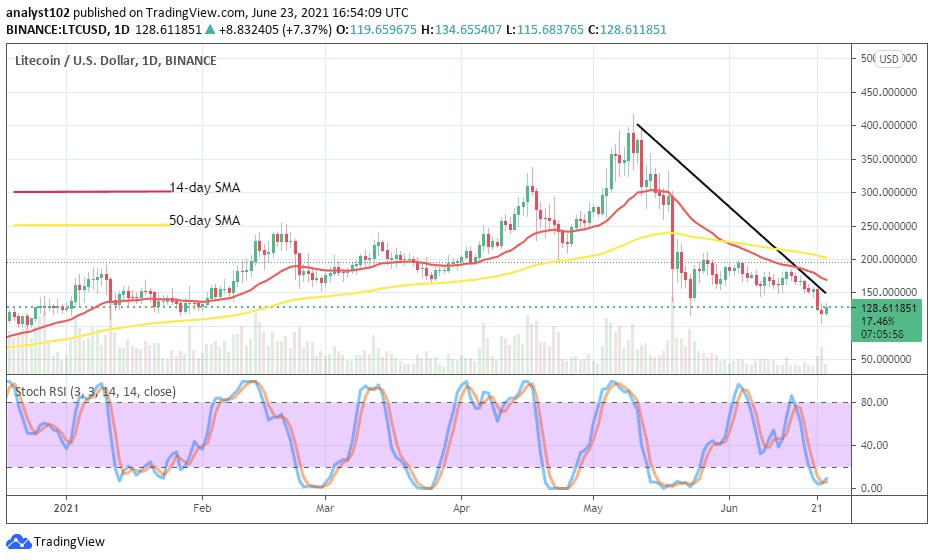
It is shown on the LTC/USD daily chart that the crypto’s value holds a position dip around its previously most lowly trading spot. As of writing, a small bullish candlestick appears somewhat beefing up in between the levels of $150 and $110 signaling a promising upswing of the market. The bearish trend-line remains laying across the SMA trend lines. The 50-day SMA indicator is placed over the 14-day SMA trend-line. The Stochastic Oscillators are in the oversold region with closed lines seemingly attempting to cross back northbound. Going by that indicator’s reading is suggesting the possibility that an upside move is in the offing.
Are there still more falling forces as the LTC/USD price holds position dip?
There seems not to be strong falling forces currently in the market operation that exists between Litecoin and the US Dollar as price holds position dip. The current trading situation of this crypto market even now suggests that the dipper the level of the higher the better chance to launch a buy entry position. In the same vein, investors could as well play along even starting at this current level of below the resistance of $150.
On the downside of the crypto trading activities, more depression forces needed to feature at the key level of $150 in resisting any move in an attempt to break through it northwardly. However, not much reliability is attached to going further with shorting positions toward the immediate support level of $110 in the event of active downward pressures. Therefore, bears needed to as well be cautious of exerting an order.
LTC/BTC Price Analysis
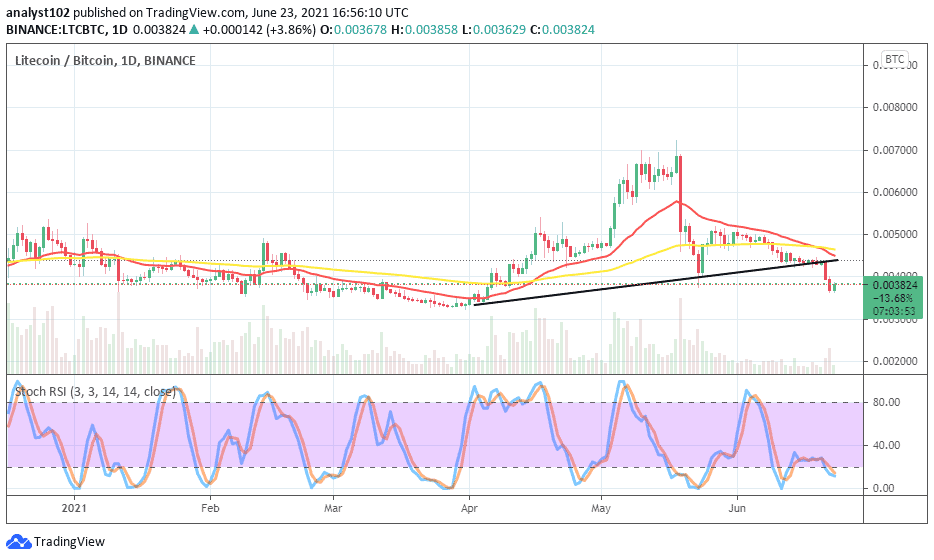
In comparison, Litecoin has lost trending weight to Bitcoin as it is now depicted on the price analysis chart. That has now led the cryptos’ price outlook to hold a position dip below the indicators. The 50-day SMA indicator is placed over the 14-day SMA trend-line as the bullish trend-line playing a supportive role underneath them has breached southwardly by a bearish candlestick that emerged on June 21. The Stochastic Oscillators are slightly bent into the oversold region probably suggesting a gradual end to the furtherance of Litecoin losing to Bitcoin in a more freeway.
Looking to buy or trade Litecoin (LTC) now? Invest at eToro!
75% of retail investor accounts lose money when trading CFDs with this provider
Remember, all trading carries risk. Past performance is no guarantee of future results.
Credit: Source link


