Litecoin Devalues Gradually Further – June 22
Even though the market valuation of LTC/USD has reached a state of being oversold from the technical outlook; price yet devalues gradually further to trade around $129 at a rate of 4.18 percent during the time of writing.
Devalues Gradually Further: LTC Market
Key Levels:
Resistance levels: $150, $200, $250
Support levels: $110, $100, $90
It is now revealed on the LTC/USD daily chart the crypto economy still devalues gradually further while the recent lower range point of $150 has breached southwardly. A well-formed bearish candlestick emerged yesterday signaling the further downward breaking. The bearish trend-line remains drawdown across the SMAs to put a mark on the spot that the decline took off. The 14-day SMA trend-line is located underneath the 50-day SMA indicator. And, they are above the current trading zone of the crypto market. The Stochastic Oscillators are in the oversold region with closed lines trying to probably cross back northbound.
Could there be a quick rebound soon as trade operation between LTC and the US Dollar devalues gradually further?
It may be taking a while before a visible rebounding move could be made as Litecoin devalues gradually further pairing with the market worth of the US Dollar. However, the stage has somewhat set in between the points of $150 and $100 that bulls may consider to join the market by adding to their trading positions. Investors could as well deem it fit to come in now to add more to their portfolio as regards the present state of the market.
Presently, the bearish candlestick that occurred during yesterday’s session has created a sell-wall through that bears may be on the lookout for a re-launch of entry. Especially, while price swings up in a fake manner along the path of the bearish candlestick. Meanwhile, reversing the market from the level of $150 could in the long run possibly lead to seeing other range-bound zones involving the lower support of $100.
LTC/BTC Price Analysis
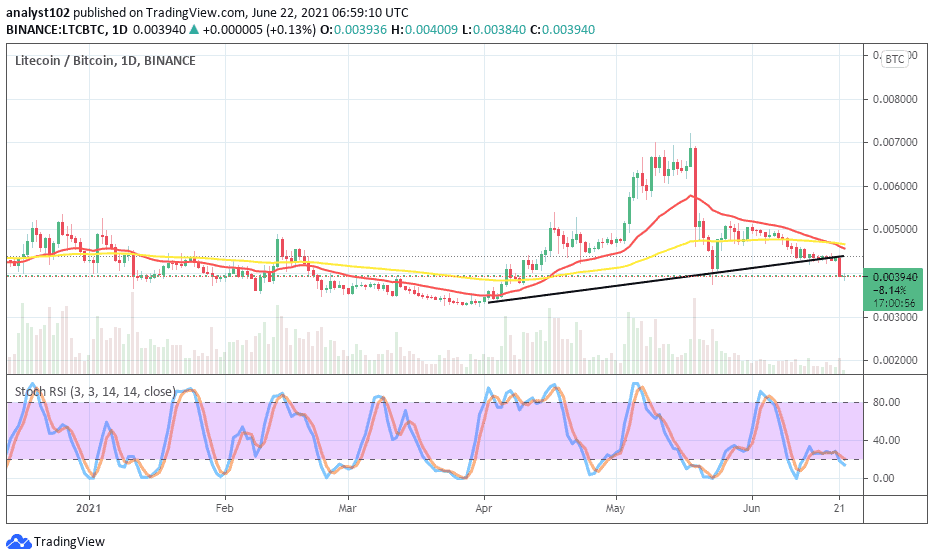
In the comparison, the price analysis chart now depicts that Litecoin devalues gradually further as it is paired with Bitcoin. In the last couple of several days’ sessions, the base has been pushed against slightly on a serial falling manner that at a time featured like sideway moving mood. But, currently, the downward force has got intensified to extent that the bullish trend-line supporting the bigger SMA indicator has breached to the south. The 14-day SMA trend-line is located over the 50-day SMA indicator. The Stochastic Oscillators have briefly bent downward from in between the ranges 40 and 20 pointing to the southbound to indicate that the base crypto is currently facing a pressure inflicted on it by the counter crypto.
Looking to buy or trade Litecoin (LTC) now? Invest at eToro!
75% of retail investor accounts lose money when trading CFDs with this provider
Remember, all trading carries risk. Past performance is no guarantee of future results.
Credit: Source link


