Join Our Telegram channel to stay up to date on breaking news coverage
The Hedera Hashgraph price prediction reveals that HBAR could stay above the 9-day and 21-day moving averages.
Hedera Hashgraph Prediction Statistics Data:
- Hedera Hashgraph price now – $0.086
- Hedera Hashgraph market cap – $2.8 billion
- Hedera Hashgraph circulating supply – 33.5 billion
- Hedera Hashgraph total supply – 50 billion
- Hedera Hashgraph Coinmarketcap ranking – #30
HBAR/USD Market
Key Levels:
Resistance levels: $0.100, $0.105, $0.110
Support levels: $0.070, $0.065, $0.060
According to the daily chart, HBAR/USD is hovering above the 9-day and 21-day moving averages as the coin crosses above the upper boundary of the channel. The cryptocurrency is likely to stay above the upper boundary of the channel, and should the buyers keep the coin above this barrier, it may create additional gains.
Hedera Hashgraph Price Prediction: HBAR/USD May Spike to the Upside
The Hedera Hashgraph price is trading bullishly, if the resistance of $0.090 gives way, the bulls may cross above the upper boundary of the channel, and the coin could create additional bullish trends. According to the daily chart, the bullish scenario is stepping back into the market as buyers continue to post firm commitments into the market. However, traders could see a sharp rise in the market if the coin reclaims the resistance level of $0.090; this could further strengthen the market to the resistance levels of $0.100, $0.105, and $0.110.
On the downside, a lower possible swing may likely come into the market to retest the previous support if the coin slides below the 9-day and 21-day moving averages. However, if the bears manage to fuel the market, traders may expect a further drop to the support levels of $0.070, $0.065, and $0.060 respectively. On the other hand, the 9-day MA remains above the 21-day MA, indicating that the market may continue with the upward movement.
HBAR/BTC Trades Bullishly
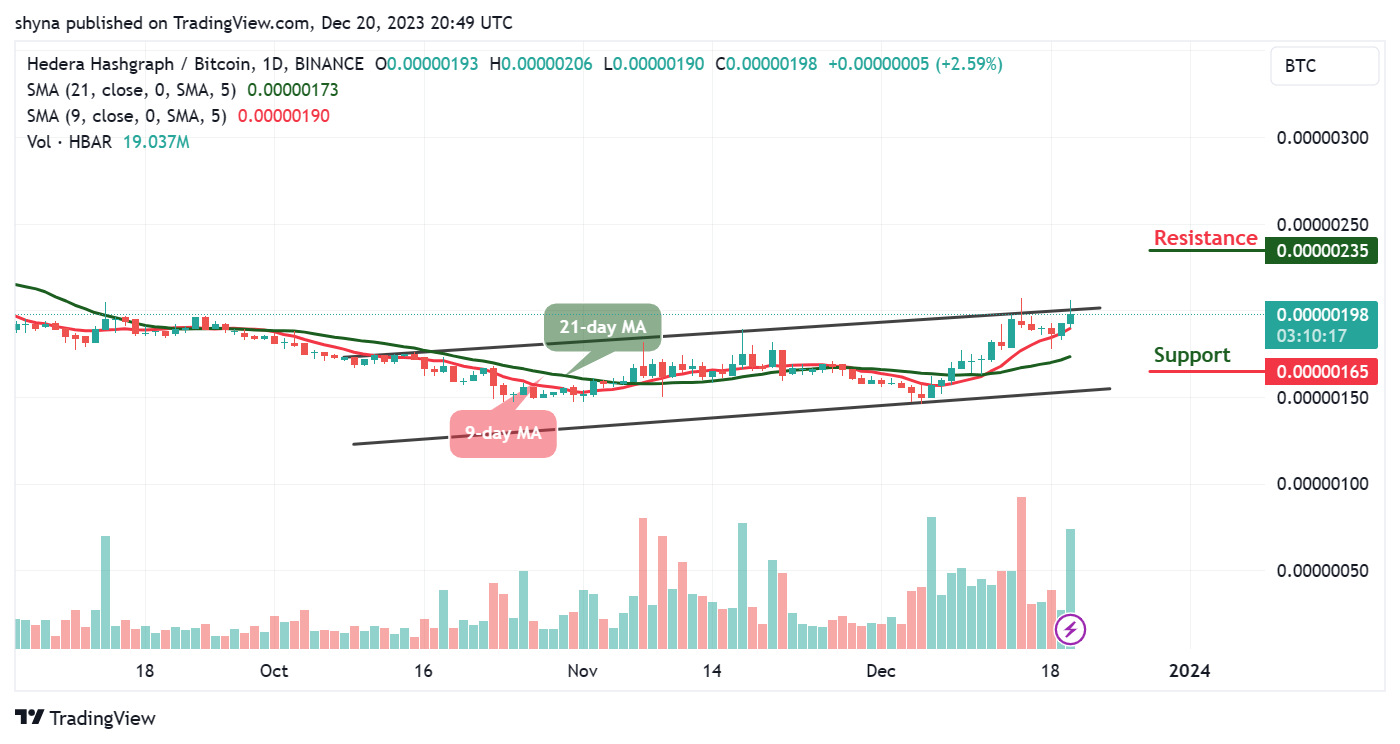
Against Bitcoin, the Hedera Hashgraph price remains above the 9-day and 21-day moving averages in other to cross above the upper boundary of the channel. However, this resistance level is expected to effectively exceed so that the market price may end up closing above it.

On the other hand, if HBAR/BTC slides below the 21-day moving average, it could refresh lows and may likely meet the major support at 165 SAT and below. Meanwhile, if the coin crosses and stays above the upper boundary of the channel, HBAR/BTC could hit the potential resistance at 235 SAT and above as the 9-day MA remains above the 21-day MA.
Hedera Hashgraph Alternatives
The Hedera Hashgraph price is currently trading with a gain of 6.52% as it crosses the upper boundary of the channel. However, if the bulls increase the pressure, the market price may hit the potential resistance level of $0.090. Meanwhile, the bears may return to the market and make the coin slide toward the lower boundary of the channel.
Meanwhile, investors should seize the opportunity in the cryptocurrency realm with $BTCMTX, an innovative token that surpasses established coins such as Hedera Hashgraph (HBAR), which holds the 30th position on CoinMarketCap. Having garnered over $5.6 million during its presale phase, $BTCMTX stands ready for remarkable growth. Investors are encouraged to take action promptly to lock in their investment at the prevailing price before the anticipated value surge.
New Crypto Mining Platform – Bitcoin Minetrix
- Audited By Coinsult
- Decentralized, Secure Cloud Mining
- Earn Free Bitcoin Daily
- Native Token On Presale Now – BTCMTX
- Staking Rewards – Over 100% APY
Join Our Telegram channel to stay up to date on breaking news coverage
Credit: Source link


