Struggles for Recovery – June 23
The recent downward forces in the market valuation of ETH/USD have now resulted to making price struggles for recovery moving manner at a lowly value. As of writing, the crypto’s point trades around the level of $1,992 at a percentage rate of 5.95.
Struggles for Recovery: ETH Market
Key Levels:
Resistance levels: $2,500, $3,000, $3,500
Support levels: $1,700, $1,500, $1,300
After a notable decline move in the market valuation of ETH/USD, price presently struggles for recovery as it is springing from a dip low-trading zone below the value of $2,000. The 50-day SMA indicator has been touched on the buy signal by the 14-day SMA trend-line in an attempt to intercept it to the south as the bearish trend-line drew across them to the downside. The Stochastic Oscillators are in the oversold region suggesting that some degree of cautious trading psyches needed to exercise especially during the time that a sell order is exerted at this level of trading situation.
Could the $2,000 and the $1,500 be levels that price struggles for recovery reliably?
The ETH/USD market values around the $2,000 and the $1,500 are the zones that price struggles for recovery could be reliable. Buyers may have to be on the lookout for price action featuring against the downward trend to be able to get a decent entry. A lot of slight downward moves are bound to happen possibly to cause panic sell-offs that could in the long run cause regrets on the part of some traders at a later time.
On the downside, much seems to have been halt as the market’s outlook currently not ideally technical to continue to short positions. Instead of shorting the positions further, the ETH/USD sellers are enjoined to hold off their stance in the market for a while. Intensification of a consolidation movement around the level of $2,000 could also in the long lead to getting to see more downs in the crypto’s market valuation.
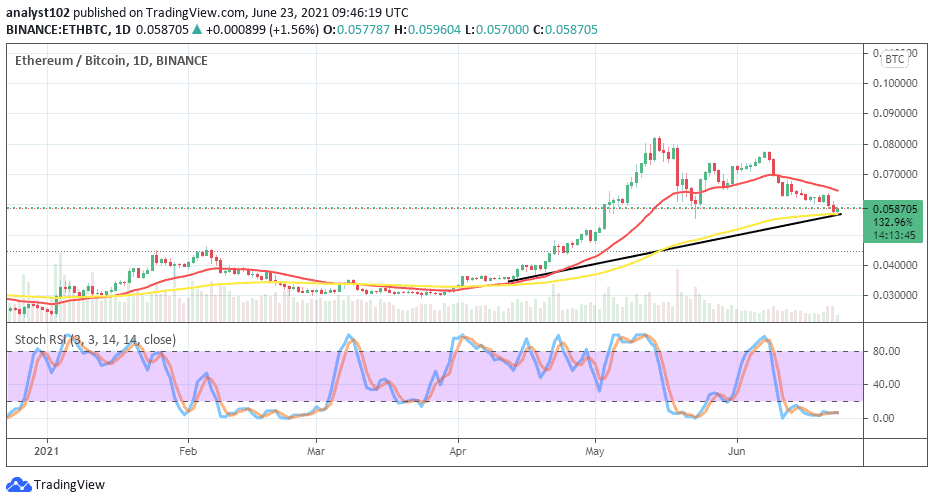
ETH/BTC Price Analysis
The valuation of Ethereum in comparison with Bitcoin appears to be on the verge of losing to the downside. There has been no sign that price struggles for recovery from what seems to be the last point of correction between the two cryptos currently. Variant candlesticks representing the current market trading zone on the price analysis chart are located tightly on the buy signal side of the bigger SMA. The 14-day SMA trend-line is situated over the 50-day SMA indicator that the bullish trend-line drew to conjoin with. The Stochastic Oscillators are in the oversold region moving in a consolidation manner to suggest a lack of definite trending capacity now ongoing between the two crypto-trading instruments.
Looking to buy or trade Ethereum (ETH) now? Invest at eToro!
75% of retail investor accounts lose money when trading CFDs with this provider
Credit: Source link


