Rebounding Moves weakened – May 29
As currently being witnessed in most of all crypto-economies generally that they now face an uglier trading situation as paired with the US Dollar, that of Ethereum versus the US Dollar isn’t different. The crypto’s price rebounding moves weakened to trade around the level of $2,300 at about a -4.71% depreciation.
Rebounding Moves Weakened: ETH Market
Key Levels:
Resistance levels: $2,500, $3,000, $3,500
Support levels: $1,800, $1,500, $1,200
ETH/USD – Daily Chart
The ETH/USD daily chart showcases a return of a falling force after attempting to swing in a recovery-moving manner. The crypto rebounding moves weakened presently after hitting resistance around the trend-line of 14-day SMA on May 27. The bearish trend-line drew across the 14-day SMA to make a strong indication of the level of $2,500 as the key resistance trading area. The 50-day SMA indicator is underneath the trend-line of the smaller SMA. The Stochastic Oscillators have slightly crossed the hairs near below range 40 seemingly trying to point toward the south direction to suggest the probability of getting to a line of reductions in the crypto trade.
ETH/USD rebounding moves weakened, will it be furthermore?
The ETH/USD price rebounding moves weakened seems now to return to the recent lowly point from which it started the upward movement. Another technical viewing point of this trade reveals that the last degree of downward moves wasn’t too far from being in correctional. Hence, the reason the bigger SMA is been trading around. Bulls have been easy finding support especially, while the bigger is breached downward.
As regards the downward movement continuation of this crypto-economy, bears have the level of $2,500 as the major point of resisting the upsurge being prepared by the base instrument. A breakdown of a point at $2,100 will energize furtherance of getting lower value in no time. However, some amount of cautiousness needs to be exercised by traders launching sell positions at that level. 
ETH/BTC Price Analysis
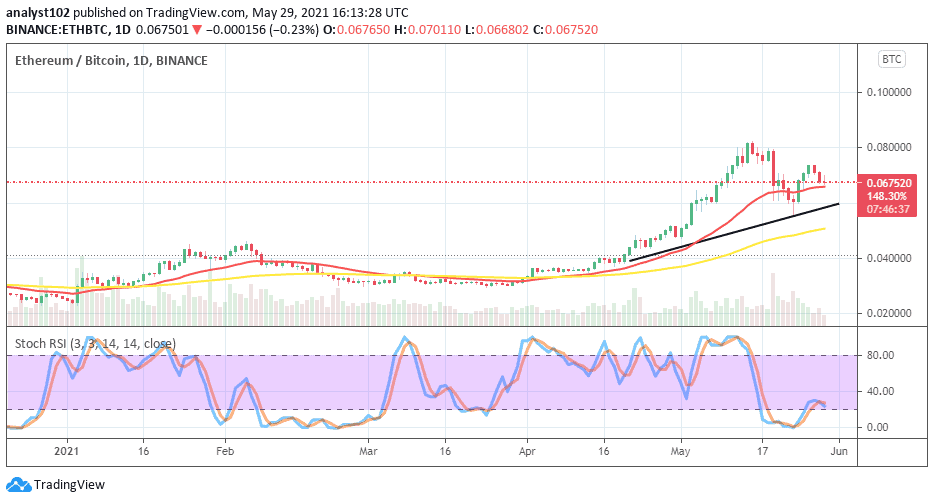
comparing the market trending capacity pairing of Ethereum with Bitcoin, the former appears to have only faced a downward correction as inflicted on the market by the latter instrument. All in all, ETH still posses a more trending capacity outlook than BTC. Price has now only reversed from the top close to the trend0line of 14-day SMA as it is situated over the 50-day SMA indicator. The bullish trend-line drew in a supportive posture to the smaller SMA to indicate the trend path as being bullish despite a line of variant price corrections. Having positioned between the oversold region and range 20, the Stochastic Oscillators have slightly closed the hairs. That could mean that less active movements may soon surface between the two cryptos.
Credit: Source link


