Breaches Southward Slightly – June 12
The market operation between Ethereum and the US Dollar breaches southward slightly at the recent lower range zone of $2,500 to now trade around $2,334 line at a reduction of -0.84 percent.
Breaches Southward Slightly: ETH Market
Key Levels:
Resistance levels: $3,000, $3,500, $4,000
Support levels: $2,000, $1,800, $1,600
ETH/USD – Daily Chart
The ETH/USD daily chart depicts that there have been serial short falling pressures in the crypto economy from June 4 until the present around the range trading zone of $2,500level. The 50-day SMA indicator and the 14-day SMA trend-line are pointing toward the east as the bearish trend-line drew across the smaller SMA at a near-front spot. The Stochastic Oscillators have slantingly bent downward from the overbought region to touch range 20. That, to some extent, indicates that the ETH/USD market may still experience more slight falling pressures.
Will the ETH/USD market hold lowering long, as it now breaches south?
Holding long lowering in the Ethereum market versus the US Dollar as price now breaches southward slightly seems releasable only for a while. In the light of that technical trading assumption, it would be necessary that bulls needed to be on the lookout as to whether a bullish signal candlestick will emerge from the depth of a lower trading zone to be able to consider a decent buy entry position.
At this point, traders contemplating to go short further as regards the level of the lower trading situation of this crypto market are enjoined to think twice. A further southward push below the $2,500 level could only be that price will heading down to test the immediate support level of $2,000. In another technical trading sense that, It is one best investment time that an investor may consider worthy of joining now.
ETH/BTC Price Analysis
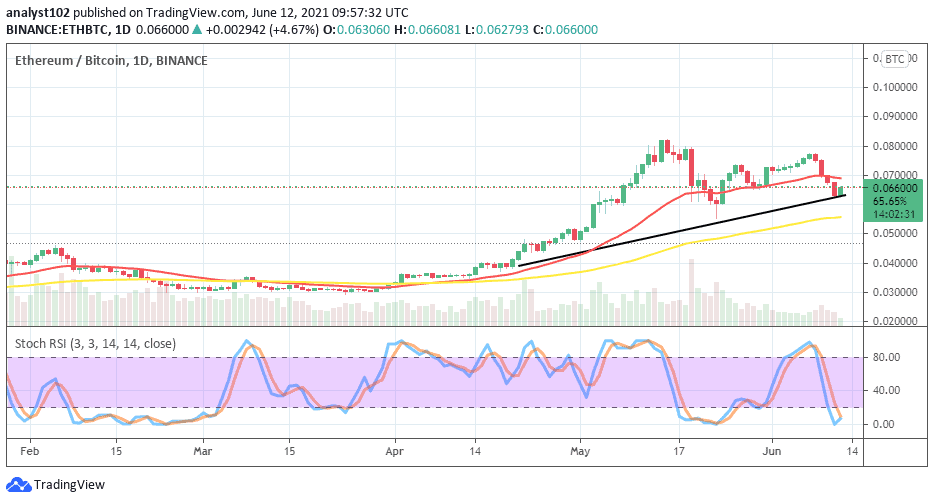
Comparing the market trending outlook between Ethereum and Bitcoin, the price analysis chart depicts that only the smaller SMA trend-line now breaches southward slightly at one of the higher levels that the base crypto has pushed against the flagship counter crypto previously. As result, the base crypto still posses more trending weight than the counter crypto. The bullish trend drew between the 14-day SMA and the 50-day SMA as they all point more importantly to the north. The Stochastic Oscillators are dipped into the oversold region with the lines closed in an attempt to possibly point back to the north. In the light of that, it could be said that the base tool will in no time regain its stances to push against the counter trading instrument.
Looking to buy or trade Bitcoin (BTC) now? Invest at eToro!
75% of retail investor accounts lose money when trading CFDs with this provider
Credit: Source link


