Trades at Lower Range-line – June 8
The trading situation between Ethereum and the US Dollar now trades at a lower range-line of the range-bound zones the market has been experiencing over a couple of sessions. Price is around $2,502 at a percentage reduction rate of -3.80.
Trades at Lower Range-line: ETH Market
Key Levels:
Resistance levels: $3,000, $3,500, $4,000
Support levels: $2,300, $2,000, $1,700
ETH/USD – Daily Chart
A bearish Japanese candlestick is currently showing in the making to signify a downward move that is slowly ongoing in the market. Today’s session appears on a higher note of tending to break down out of the long-kept range-bound zones of $3,000 and $2,500. The 50-day SMA indicator is placed as a supportive tool to the lower range-line below the 14-day SMA trend-line. The bearish trend-line drew downward briefly past the smaller SMA. The stochastic Oscillators are have crossed the lines from the overbought region to a position between ranges of 80 and 40 pointing toward the southbound.
ETH/USD trades at a lower range-line, would there soon be a forceful breakdown?
Going the pace at which the ETH/USD trades at a lower range-line, the crypto’s value appears to be on verge of going down for it. The reading of Stochastic Oscillating indicators has somewhat confirmed it by pointing southbound close above range 40. However, the price seems to be taking time to align more visibly in regards to that. A reversal of bearish move below or around the $2,500 lower range-line may pave way for a decent buy order.
It is closely observed that the current lower range-line has now to be the focus trading area for bears to hold their stands stronger in the crypto economy. A bouncing-off of price from that level could lead the market back into achieving some of its lost higher values in the process. Being as it is, bears have the better chance of pushing down price past the lower range-line.
Looking to buy or trade Ethereum (ETH) now? Invest at eToro!
ETH/BTC Price Analysis
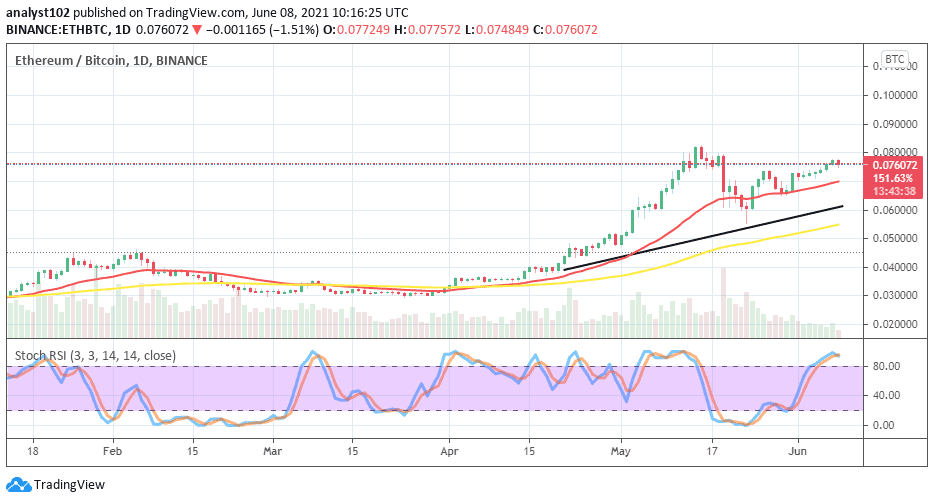
Ethereum, as the base instrument, yet possesses much trending power than Bitcoin, as the flagship counter crypto. The daily price analysis chart depicts that a formation of candlesticks characterized by higher lows on the buy signal side of the smaller SMA trend-line. The 14-day SMA trend-line is above the 50-day SMA as the bullish trend-line drew between them indicating an upside direction. The Stochastic Oscillators in the overbought region with closed lines possibly suggest a pause in the market trend between the two cryptos.
75% of retail investor accounts lose money when trading CFDs with this provider
Credit: Source link


