Trade Rallies Closer to $3,000– March 20
Several failed attempts had happened to keep the ETH/USD market below a critical support line at $2,500. The aftermath of that scenario has brought about making the crypto-economic trade rallies close to $3,000. The trading activity has witnessed a high of $2,965 and a low of $2,910 at a minute negative percentage of 0.82.
Trade Rallies Closer to $3,000: ETH Market
Key Levels:
Resistance levels: $3,250, $3,500, $3,750
Support levels: $2,750, $2,500, $2,250
ETH/USD – Daily Chart
The ETH/USD daily chart showcases the crypto trade rallies closely to $3,000. The situation portends swinging up to have a retest of a previous higher resistance as a line of price rejections has been piling near beneath the trend line of the bigger SMA trend line. The 14-day SMA indicator is underneath the 50-day SMA indicator. The Stochastic Oscillators are in the overbought region with their lines closed. That signifies the crypto’s price may be dropping in the near time against the US Dollar’s purchasing strength after a while.
Will the breaking out of the $3,000 level signify a return of more ups as the ETH/USD trade rallies closely to it presently?
The breaking out of the $3,000 level is expected not to be a reliable sign that a return of more ups will be featured for sustainability as the ETH/USD trade rallies closely to it presently. An indicator suggests that the crypto market has reached an overbought trading zone. Further upward pushes may be forthcoming in a slow-and-dicey moving mode. While that presumption is materializing, getting a decent entry will be difficult. However, long-position takers should also, at the same time, be wary of exerting new orders in the process.
On the downside of the technical analysis, the ETH/USD market short-position placers needed to brace up for a strong reversal from a higher resistance trading zone of $3,000 afterward. It has now been shown on the chart that the price is running in a rejection outlook. And the situation is most likely to witness a declining motion if the market visibly finds pushing more for highs uneasy in the near time.
ETH/BTC Price Analysis
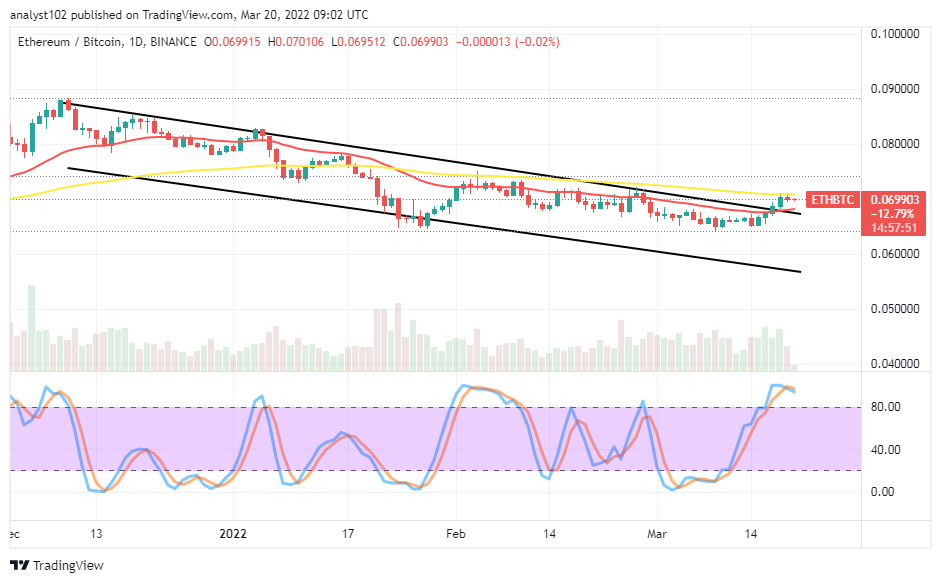
In comparison, Ethereum’s trending ability against Bitcoin has now been striving to push higher to the north side. The cryptocurrency pair trade rallies to touch the trend line of the bigger SMA trend line. The 50-day SMA indicator is above the 14-day SMA indicator. The Stochastic Oscillators are in the overbought region with their lines conjoined in an attempt to cross southbound within. That signifies that the base crypto may be lowering momentum as juxtaposed with the flagship cryptocurrency.

Looking to buy or trade Bitcoin (BTC) now? Invest at eToro!
68% of retail investor accounts lose money when trading CFDs with this provider.
Read more:
Credit: Source link


