Struggles Pushes at $2,000 – June 30
The market operation pairing Ethereum and the US Dollar currently struggles to push around the level of $2,000. The US fiat currency loses position slightly to let the crypto’s value trade around $2,105 at about a negative percentage rate of 2.74.
Struggles Pushes at $2,000: ETH Market
Key Levels:
Resistance levels: $2,500, $3,000, $3,500
Support levels: $1,900, $1,700, $1,500
It is showcased on the ETH/USD daily chart that the crypto market valuation now struggles pushes around a crucial trading zone of $2,000 as trading indicators are also seen near over the spot. The 50-day SMA trend-line is a bit over the 14-day SMA trend-line. And, the bearish trend-line drew closely alongside the smaller SMA to intercept the bigger SMA slightly at a tail end. The Stochastic Oscillators are slowly making a move into the overbought region. And, they now seemingly attempt to close the lines. That could cause a suspension in seeing a definite movement in the crypto economy.
Could there be a reliable upward move in the ETH/USD trade as price struggles push around $2,000?
As of this point of trading, Ethereum’s price struggles pushes against the valuation of the USD around the level of $2,000 still somewhat appears that the base instrument looks like losing momentum in the near time to the counter tool. As a result, bulls may have to hold off going further with their ride to the north for a while until the market makes a tangible pull-down for support away from the current trading zone.
On the downside, a long-featuring of the ETH/USD market around half a point between $2,000 and $2,500 may, in the long run, make way for a downturn in the ETH/USD trade.However, the points between the level of $2,000 and $1,500 are regarded as areas that bears are tended to lose their positions to many reasonable technically inclined buying entries. 
ETH/BTC Price Analysis
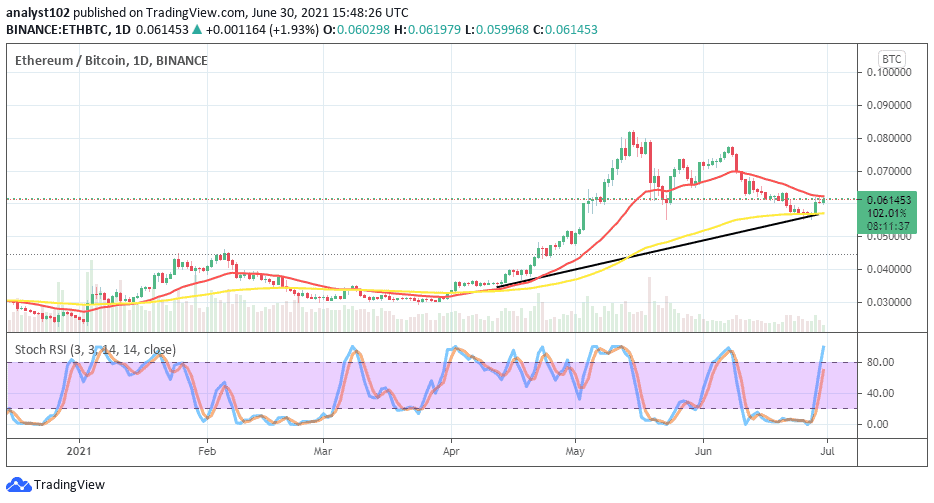
The ETH/BTC price analysis chart presently depicts that the base crypto struggles push against the flagship counter trading instrument. Bitcoin pushed against Ethereum in a manner of correction that eventually led to locating support around the bigger SMA. A smaller number of candlesticks are being formed tightly against the smaller SMA from below. The 50-day SMA is underneath the 14-day SMA. And, the bullish trend-line continues to play a supportive role to the bigger SMA indicator. The Stochastic Oscillators have swerved the blue line into the overbought region. That portends that the pressures to the upside seem not that active.
Looking to buy or trade Ethereum (ETH) now? Invest at eToro!
75% of retail investor accounts lose money when trading CFDs with this provider.
Credit: Source link


