Strives to Make Swing-high – May 31
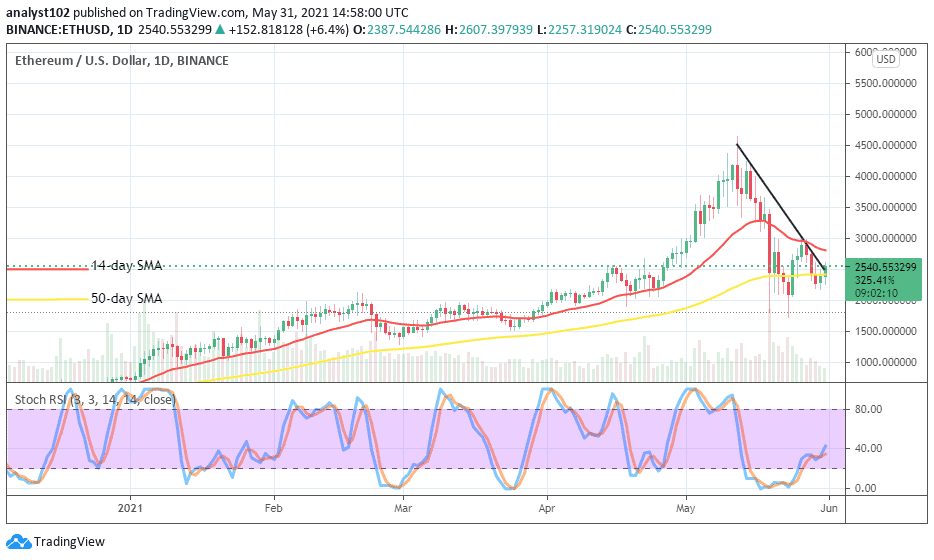
There have been several indications that the market of ETH/USD now strives to make swing-high past a key level of $2,500 that has been one of the most difficult lower trading lines that the crypto experiences. The crypto now makes an appreciation move to trade around the level of $2,595 at about an 8.70% increase.
Strives to Make Swing-high: ETH Market
Key Levels:
Resistance levels: $3,000, $3,500, $4,000
Support levels: $2,100, $1,800, $1,500
ETH/USD – Daily Chart
As of writing, a bullish candlestick is in the upward move building process to suggest on the ETH/USD chart that the crypto strives to make swing-high in the market. The bearish trend-line is being breached to the north attest to that present trading scenario. The 50-day SMA indicator is located underneath the 14-day SMA trend-line. Price now appears slowly increasing toward the area of the smaller SMA. The Stochastic Oscillators are attempting to open the hairs slightly to the north past range 40 to probably add more to the upward move that is gradually materializing in the crypto-economy.
How long the ETH/USD market strives to make swing-high?
It may not be easily projected now that how long the ETH/USD market strives to make swing-high in the trade operations. But, going by what the Stochastic Oscillators indicate, bulls seem to be on a higher note of getting a better hold of the market in no time. However, another awaiting vital resistance level is seen at $3,000 as price tends to experience a pit stop while slowly making pushes to the upside.
Bears may still have the chance to resist the ongoing swing-high that is being made in the market as long as price hasn’t pushed past the level of $3,000. The smaller SMA has positioned near below the point to potentially authenticate a point around which an upward move of the ETH/USD market may witness unsmooth riding at a later session.
ETH/BTC Price Analysis
It has now depicted on the ETH/BTC daily price analysis chart that the base crypto has to some extent embarked on an increase in trending-worth as compared with the most valuable counter trading instrument. In other words, Ethereum’s valuation now strives to make swing-high as a bullish candlestick is in the making on the buy signal side of the smaller SMA to ascertain that. The 50-day SMA is located below the 14-day SMA. And, they both point towards the north. The Stochastic Oscillators are seemingly trying to open the hairs pointing in the direction of northbound as well to signify the probability of getting to see the base crypto to the upside as pairing with the flagship counter crypto.
Remember, all trading carries risk. Past performance is no guarantee of future results.
Credit: Source link


