Returns Lowering in Values – June 26
There have been returns to lowering in values of market activities that feature between Ethereum and the US Dollar. As of the time of writing, the crypto’s value stands around $1,767 at the rate of around -2.37 percent.
Returns Lowering in Values: ETH Market
Key Levels:
Resistance levels: $2,000, $2,500, $3,000
Support levels: $1,600, $1,400, $1,200
In an extension of the serially falling of the crypto market, the ETH/USD daily chart currently shows that price returns to lowering in values under the line of $2,000 resistance. The 50-day SMA indicator has been freshly intercepted from the top by the 14-day SMA trend-line as the bearish trend-line drew downward across them to get placed on the current immediate resistance of the same point earlier mentioned. The Stochastic Oscillators are in the oversold region with closed lines in an attempt to cross to the southbound to indicate that the downside move is probably yet to be exhausted.
ETH/USD market’s returns lowering in values, could there still be more long downsides?
There have been more systemic downward forces in the ETH/USD market as price returns lowering in values underneath the value of $2,000 about a couple of days’ sessions. As for the meantime, the downsides that may be forthcoming tend to lack sustainable momentum especially, beyond the smaller level of $1,500 at a later volatile movement. As the market tends to push down to the lower point latterly mentioned, the price is to regain momentum.
Going downward further of this crypto market may continually be while bears consolidate their presence around or below the point of $2,000 for a long time of trading days’ operations. In the event of that assumption playing out, a line of side-way trading situations is liable to occur. In addition to that, the point earlier mentioned and a smaller of it around $1,500 is most probably the focus where the moves will be featuring afterward.
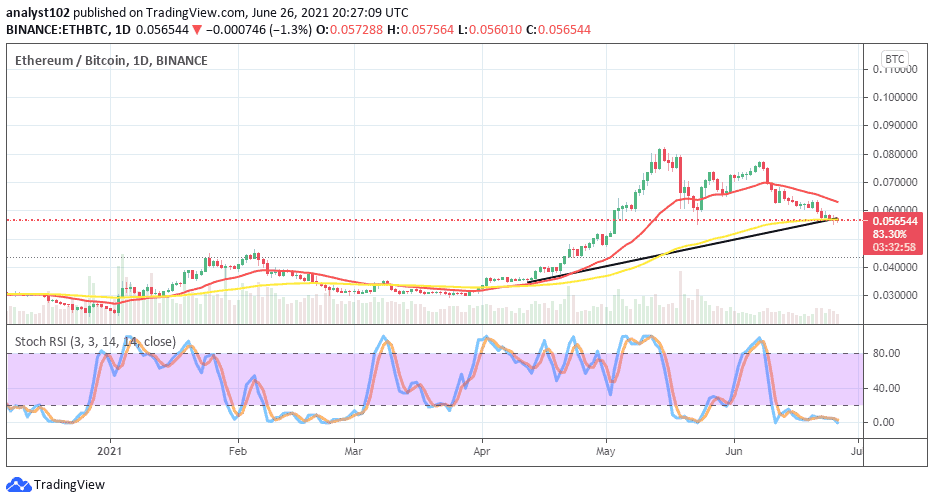
ETH/BTC Price Analysis
The trending outlook between Ethereum and Bitcoin returns lowering in values as of being corrected as against being visibly lost out. In other words, the base crypto still somewhat has the weightier catalyst to push northward at a later session. The 50-day SMA indicator and the bullish trend-line are closely located below the present market’s trending spot on the price analysis chart as the 14-day SMA trend-line bends southward over them. The Stochastic Oscillators are dip into the oversold region with conjoined lines consolidating within it. That signifies that the base crypto is yet under being pressured by the counter trading instrument to some extent.
Looking to buy or trade Ethereum (ETH) now? Invest at eToro!
75% of retail investor accounts lose money when trading CFDs with this provider
Credit: Source link


