Join Our Telegram channel to stay up to date on breaking news coverage
Price movements in the Ethereum market appear to have started consolidating. Also, technical indicators further Reveal that price action may just range sideways at this point. Nevertheless, there are still some signs in the ETH/USD market that foretells some impending, and interesting price moves which are worth noting.
Ethereum Analysis Statistics Data:
Ethereum’s value now: $1,311
ETH’s market cap: $158.70 billion
EHT’s moving supply: 122.74 million
Total supply of Ethereum: 132.74 million
ETH’s Coinmarketcap ranking: #2
Consequently, we shall commit some effort to carefully understand these possibilities and move for proper utilization. Additionally, we’ll examine the ETH/BTC market with the same motives in mind as that of ETH/USD.
Key Price Levels:
Top Levels: $1,320, $1,330, $1,340
Bottom Levels: $1,311, $1,300, $1,290
Ethereum Price Prediction Today October 11, 2022: ETH/USD Consolidation May Result in a Downtrend
Price action on the ETH/USD daily chart generally may consolidate, as the yet-to-be-tested Fib level may hold as a support. Nevertheless, as price action appears to be poised to tear down this resistance, we might want to exercise more caution. The last bearish price candle was able to put Ethereum’s price below the MA of the Bollinger. Consequently, this has opened the door for more downside price movements. Additionally, the RSI lines seem to be in pursuit of the oversold area. If the downward forces retain control price will fall further lower towards the Fib level of 78.60 of the price of $1,275. However, the question of whether it will hold depends on if a considerable number of Traders have mounted a buy order at this Fib level.


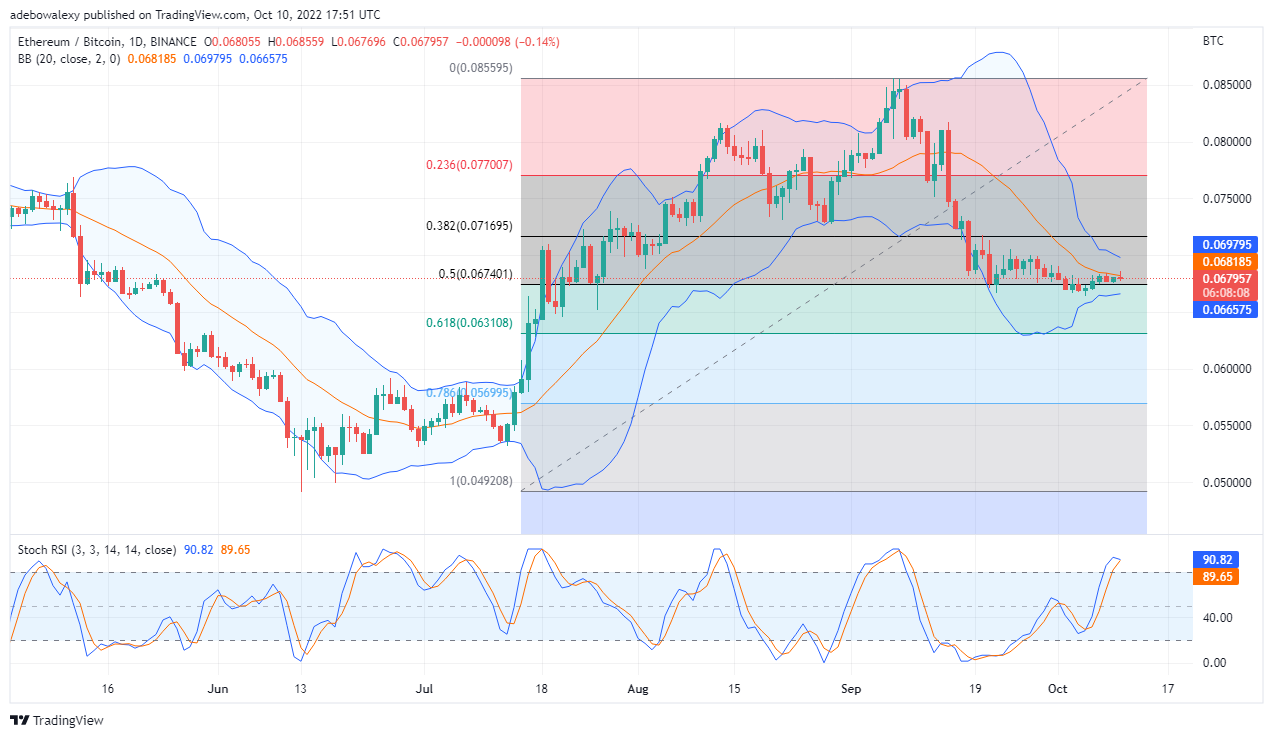
Ethereum Price Prediction Today October 11, 2022: ETH/BTC Recover Above the Fib 50, but May Fall Under It Shortly
Examining the ETH/USD daily chart will reveal that the recent price recovery above the 50 Fib level may soon be lost. This can be seen as the last candle on this chart stays in favor of the Bears. Also, the MA of the Bollinger indicator appears to act as a strong resistance, which is why the last price candle seems to correct off it.
Buy Etherum Now
Your capital is at risk.
Also, it could be seen that the Stochastic RSI lines are now in the overbought zone. Plus, they are about to perform a bearish crossover. Consequently, this implies that ETH/BTC price may fall lower and from the looks of the Bollinger indicator a significant downward correction. Even if an upside reversal is to occur, then it won’t be long before the long-term downtrend continues, given the current level of the RSI curves which are at 91% and 90% levels. Price action in this market may soon fall towards 0.063108.
Tamadoge – Play to Earn Meme Coin
- Earn TAMA in Battles With Doge Pets
- Maximum Supply of 2 Bn, Token Burn
- Now Listed on OKX, Bitmart, LBank, MEXC, Uniswap
- Ultra Rare NFTs on OpenSea
Join Our Telegram channel to stay up to date on breaking news coverage
Credit: Source link


