Market Breaks Down at $4,000– December 13
The ETH/USD market breaks down at $4,000 for another note-worthy time during today’s session. The crypto economy declines, trading around $3,830 at a lower average rate of about -7.34 percent.
Market Breaks Down at $4,000: ETH Market
Key Levels:
Resistance levels: $4,250, $4,500, $4,750
Support levels: $3,750, $3,500, $3,250
ETH/USD – Daily Chart
The ETH/USD daily chart reveals that the crypto market breaks down at $4,000, leading the price to push through some underlying support levels in the process. The 14-day SMA indicator is over the 50-day SMA indicator, with a bearish candlestick moving against the bigger trading tool around the value line. The Stochastic Oscillators are at the range 20 as the lines seemingly attempt to open around it. That suggests the possibility that the market may soon make a rebounding move.
In what manner can the $4,000 level breach out rightly as the crypto market breaks down around the point?
Expectations are still high that the price cannot survive breaching at $4,000 level out rightly as the ETH/USD market breaks down around the point. The pushing of the crypto economy underneath the value line seems to last for a short time to pave the way for the return of swing highs. Therefore, if that assumption is correct, the exertion of more sell positions around that trading capacity zone will lose out in no time.
In contradiction to the above upside technical analysis of this crypto-economy trading against the US Dollar, traders that still nurse the biased mind of going short needed to continue to intensify efforts to push back the market southwardly around $4,000. However, a long-holding of the market operations beneath the trend line of the 50-day SMA may lead to an indecision situation for both the two market movers.
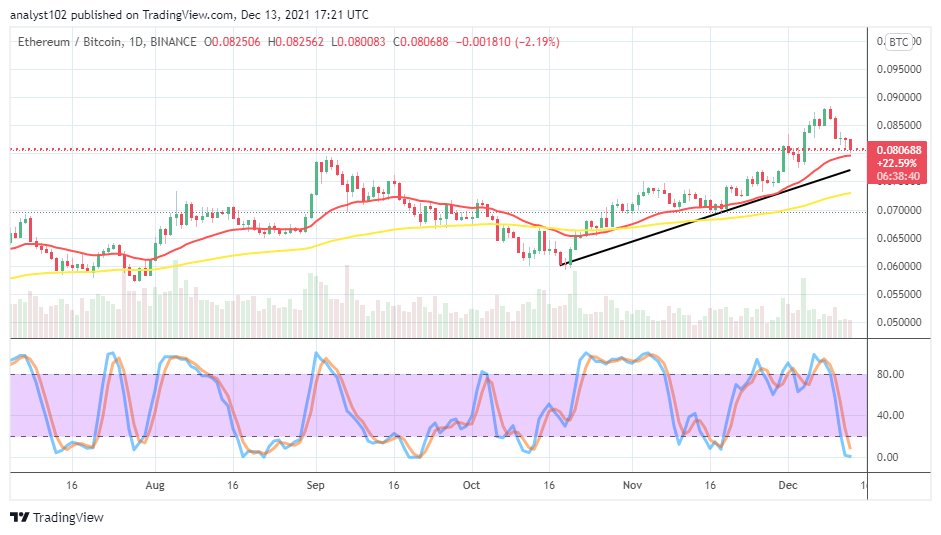
ETH/BTC Price Analysis
In comparison, Ethereum yet appears not to lose out on the trending capacity of Bitcoin as depicted on the price analysis chart. The crypto-coin pair market breaks down close to the trend line of the smaller SMA at a higher trading spot. The 50-day SMA indicator is underneath the 14-day SMA indicator. The Stochastic Oscillators are in the oversold region, attempting to close the lines at the range of zero. That signifies that the counter crypto may relax in its efforts, pushing against the base crypto round a higher trading zone.
Looking to buy or trade Bitcoin (BTC) now? Invest at eToro!

68% of retail investor accounts lose money when trading CFDs with this provider.
Read more:
Credit: Source link


