The Polkadot price prediction could set a bullish run if the market attempts to climb back above the resistance level of $10.
Polkadot Prediction Statistics Data:
- Polkadot price now – $9.44
- Polkadot market cap – $9.3 billion
- Polkadot circulating supply – 987.5 Million
- Polkadot total supply – 1.1 billion
- Polkadot Coinmarketcap ranking – #11
DOT/USD Market
Key Levels:
Resistance levels: $14, $15, $16
Support levels: $6, $5, $4
At the moment, DOT/USD is at the movement running a little retracement move towards $10 with price growth of 0.85%. For the fact that the coin is recording a little gain, the Polkadot price may continue to maintain a sideways movement within the channel. Therefore, traders can expect the price to rise as soon as the bulls put more pressure on the market.
Polkadot Price Prediction: What to Expect from Polkadot (DOT)
If the Polkadot price stays below the 9-day and 21-day moving averages, the market price may slide towards the lower boundary of the channel. But if the price follows the upward movement, traders can expect a bullish continuation above the upper boundary of the channel. Meanwhile, as the technical indicator Relative Strength Index (14) is seen moving around 40-level, the possible resistance levels could be found at $14, $15, and $16 in the long term.
However, if the coin resumes the bullish movement in the next couple of days, traders may witness the Polkadot price reach higher levels. Meanwhile, DOT/USD is still moving sideways. Inversely, a bearish movement could roll the coin to the long-term support at $6, $5, and $4 levels.
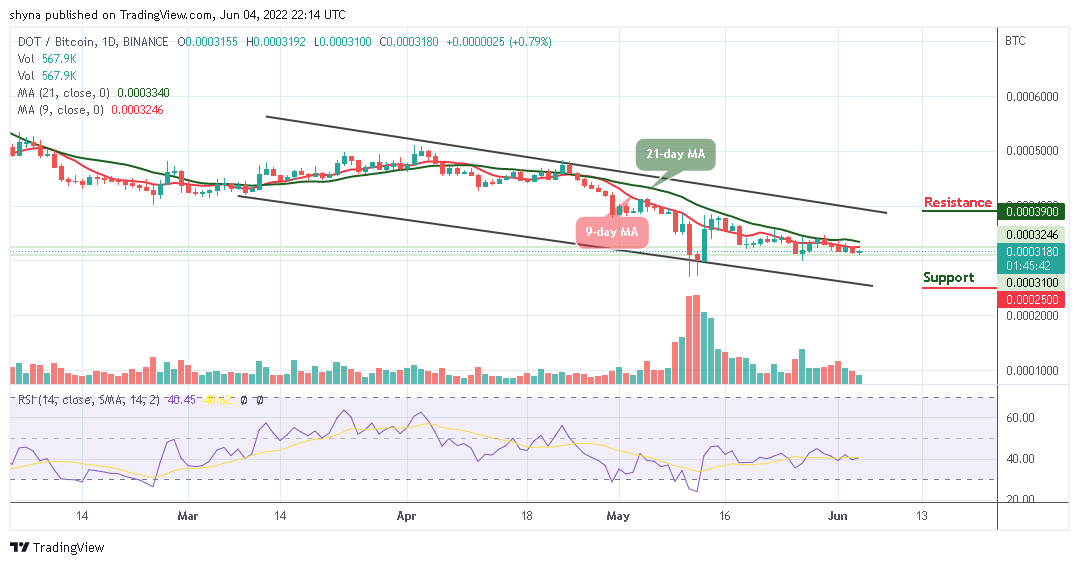
Against Bitcoin, Polkadot continues to follow the sideways movement but is trading below the 9-day and 21-day moving averages. In case of a trend reversal, there is a need for an increasing volume and resistance to cause an upsurge in the market. At the moment, Polkadot (DOT) is trading around 3180 SAT. Therefore, traders can expect a close support level at 2500 SAT and below.

However, if a bullish move occurs and validates a break significantly above the 9-day and 21-day moving averages to hit the nearest resistance at 3500 SAT; traders can confirm a bullish movement for the coin, and the closest resistance lies at 4300 SAT and above. The technical indicator Relative Strength Index (14) is moving around 40-level, suggesting sideways movement.
eToro – Our Recommended Crypto Wallet
- Exchange Wallet for 120+ Cryptocurrencies, Trade In-Wallet
- Automatic Staking of ETH, ADA or TRX in your Wallet
- Regulated by FCA, ASIC and CySEC – Millions of Users
- Unlosable Private Key – Secure eToro Recovery Service
68% of retail investor accounts lose money when trading CFDs with this provider.
Read more:
Credit: Source link


