Bitcoin Price Prediction – November 24
The Bitcoin price could have make an attempt to cross above the 9-day moving average, but the coin failed to continue higher.
BTC/USD Long-term Trend: Ranging (Daily Chart)
Key levels:
Resistance Levels: $63,000, $65,000, $67,000
Support Levels: $50,000, $48,000, $46,000
BTC/USD is currently trading below the 9-day and 21-day moving averages around $56,047 level while a break above this barrier could have pushed the first digital asset back into bullish domains. Meanwhile, a key indicator is on the verge of breaking out of the sideways movement which could potentially lead to a reversal from the current bearish price trends.
Bitcoin Price Prediction: Would Bitcoin Slides Below $55,000?
After opening today’s trade at $54,562, the Bitcoin price is seen retracing and trading under the 9-day and 21-day moving averages while the market price stays beneath as a sign of bullish momentum. However, a further increase in the bullish momentum may later push the price above the resistance level of $58,000; above it is another resistance at $60,000 before reaching the potential resistance of $63,000, $65,000, and $67,000 levels.
On the contrary, should the $56,000 support level fail to hold, the Bitcoin price may reverse and face additional support level at $53,000; therefore, a further increase in the bears’ pressure may push down the price below the lower boundary of the channel and possibly hit the critical supports at $50,000, $48,000, and $46,000. Meanwhile, the technical indicator Relative Strength Index (14) is moving around 40-level, crossing below it may ignite sell signals into the market while breaking above the moving averages may cause the coin to resume the bullish movement.

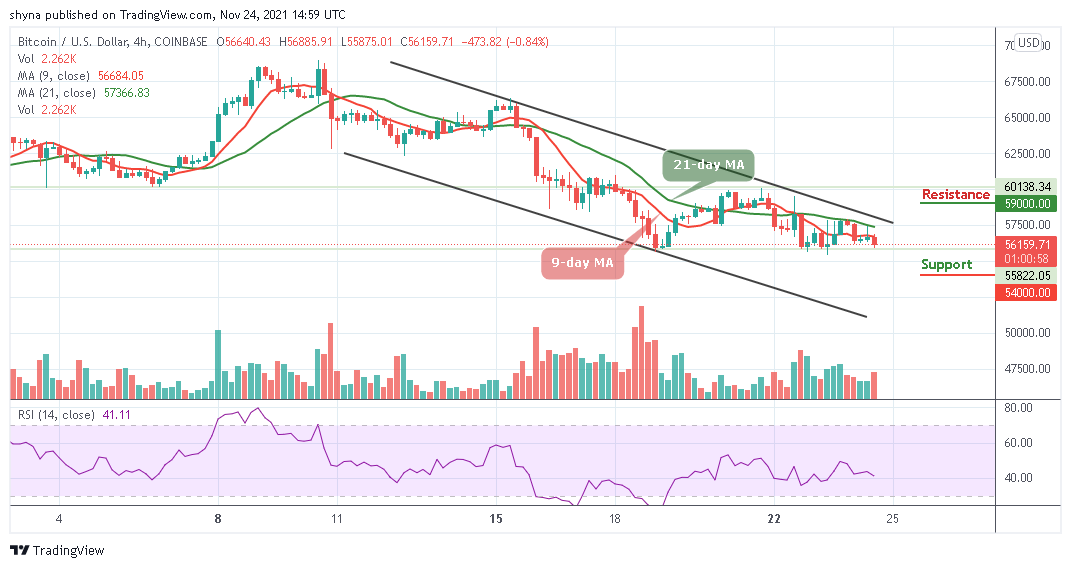
BTC/USD Medium – Term Trend: Bearish (4H Chart)
According to the 4-hour chart, the fast-moving 9-day MA remains below the slow-moving 21-day MA; the market price is trading below the 9-day moving average as a sign of bearish momentum. However, in case the current market value of 56,159 level still holds, the bears may exert pressure to break down the important support level and the price may decline to $54,000 and below.

Moreover, on the upside, should the bulls push the market price above the upper boundary of the channel, the resistance level of $58,000 may be penetrated and the price may increase to $59,000 and above. Meanwhile, the technical indicator Relative Strength Index (14) is moving towards 40-level, crossing below this level may suggest a bearish signal.
Looking to buy or trade Bitcoin (BTC) now? Invest at eToro!
68% of retail investor accounts lose money when trading CFDs with this provider
Read more:
Credit: Source link


