Bitcoin and other major altcoins have been on a consistent free fall and even hit multi-yearly lows. BTC even touched $17,000 mark this month, however, the king coin has now reclaimed its $20,000. Over the last week, the coin lost 22% of its value but on the daily chart it gained close to 7%.
Technical outlook for the coin has picked up bullishness but still reflects signs of weakness. Buyers also have returned to the market, but if buying strength drops again BTC might find support close to $17,000. It is still difficult to say if the coin has bottomed out.
Many altcoins also jumped on their chart as Bitcoin showed signs of relief. This also included Ethereum that pushed up by 9% over the last 24 hours. The global cryptocurrency market cap today was at $950 Billion with an increase of 6.1% change in the last 24 hours.
Bitcoin Price Analysis: One Day Chart
BTC touched its 18-month low as the coin dipped near the $18,000 mark yesterday. Pressure from sellers have constantly pushed the price of the further below. Despite a jump back to the support level of $20,000, sellers are still in control of the market.
Overhead resistance for the call stood at $22,000 and a fall from the $20,000 will cause BTC to trade near the $17,000 to $16,000 mark. BTC’s trading volume also fell on the chart. The bar was seen in red, this was an indication that Bitcoin was still in control of the bears.
Technical Analysis

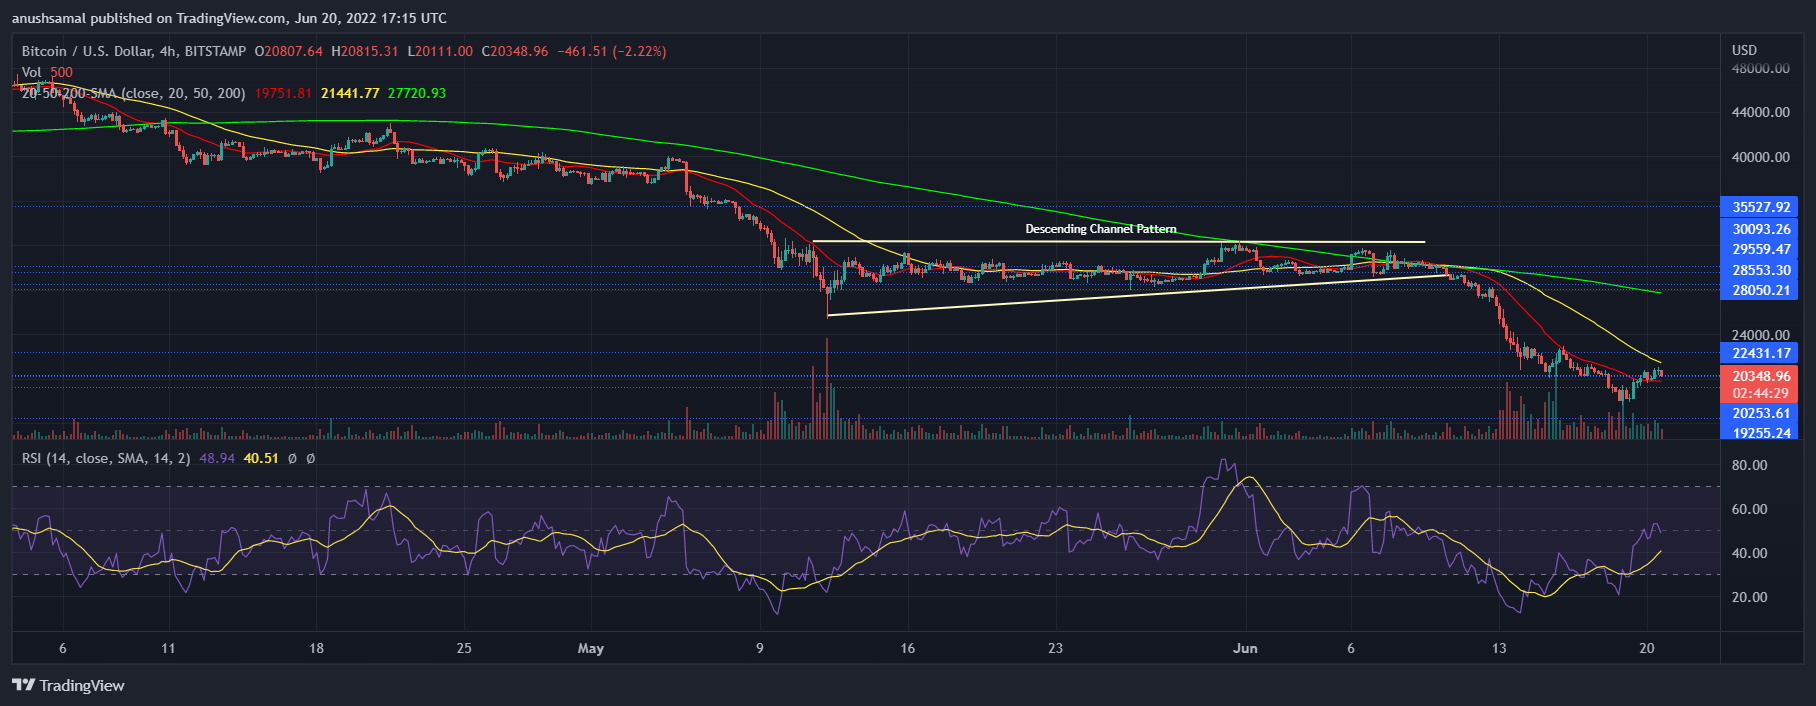
On the smaller time frame, Bitcoin showed bullish signals. The Relative Strength Index shot up heavily and touched the 50-line, which meant resurfacing of buyers in the market. Over the last 24 hours however, there was a downtick on the RSI which again signified a tiny fall in buying strength.
As buyers increased in number, the price moved over 20-SMA line. This meant that buyers were driving the price momentum in the market. An increase in selling pressure would soon bring the price of BTC below the 20-SMA line, giving sellers the power to drive the price momentum.
In accordance to bullishness, the coin had formed a descending channel pattern (yellow). This pattern is a bullish reversal pattern which points towards a chance of BTC rising further on its chart. Buying strength needs to increase for the price to remain steady above the $20,000 mark.
Related Reading | Over $250 Million In Liquidations As Bitcoin Recovers Above $20,000

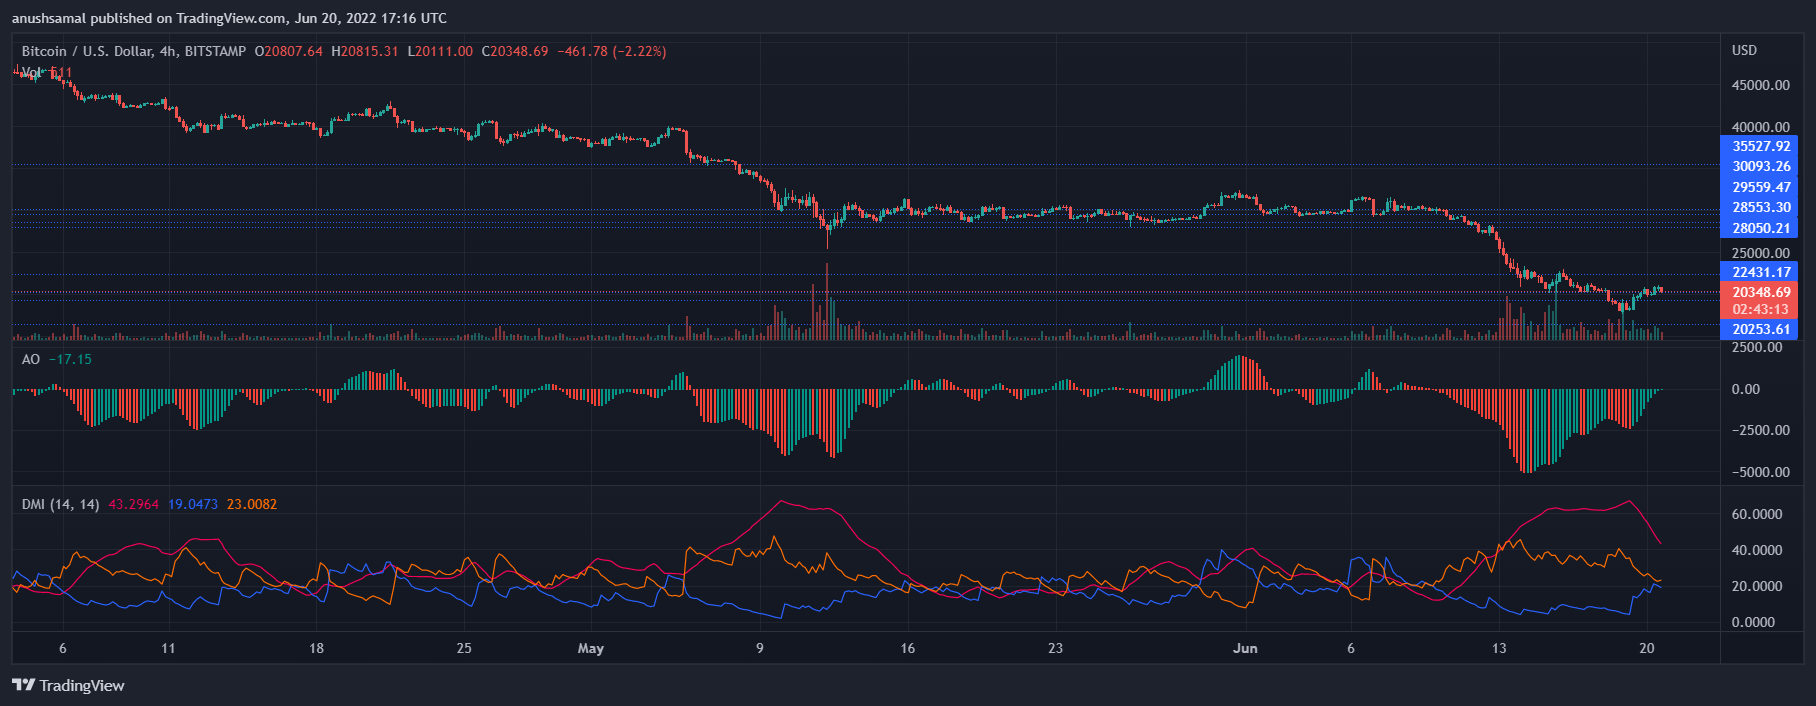
The coin was optimistic on its chart at the time of writing. Reflecting the same Awesome Oscillator also displayed positive price action. AO determines price trend and reversals. The indicator displayed green histograms which are also tied to a buy signal.
Directional Movement Index indicates directional price movement of the coin. +DI was above the -DI line and that meant bullishness. ADX (red) was on the fall and was moving closer to the 40-mark, a fall below the 40-mark means that the current trend is losing its vigour and that BTC might again fall on the charts.
Related Reading | Why Bitcoin Could Take Another Bite At $17K
Credit: Source link


