BCH Shows Recovery Move – May 26
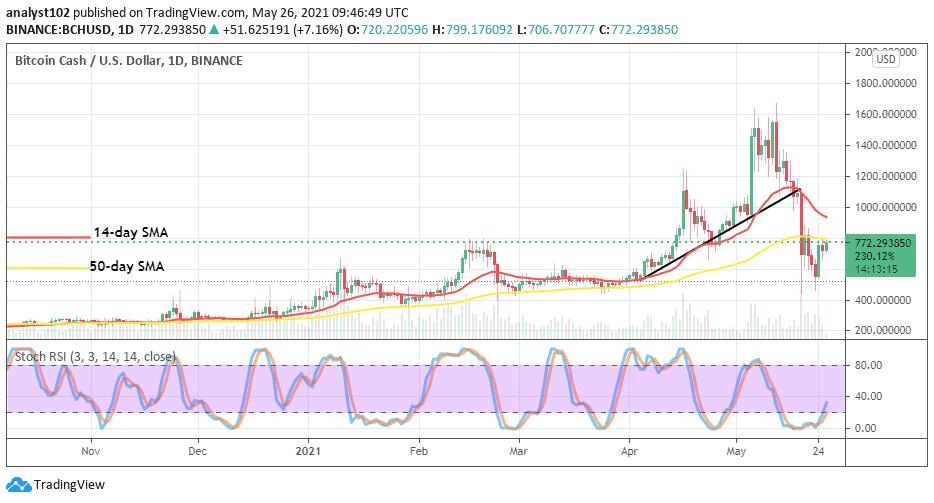
The BCH/USD market valuation shows recovery move after the crypto’s price fell to approach the lower zone of $400 support level in the previous downward trading activities. The crypto now trades around the line of $772 at a 7.20% appreciation.
Shows Recovery Move BCH Market
Key Levels:
Resistance levels: $900, $1,100, $1,300
Support levels: $500, $400, $300
BCH/USD – Daily Chart
The BCH/USD daily chart shows variant candlesticks characterizing shows recovery move of the crypto from the drawdown it has been suffering in the recent past sessions. The 14-day SMA has slightly bent downward across the level of $1,000 over the 50-day SMA indicator that is located at the value of $800. The Stochastic Oscillators have crossed the hairs from the oversold region to face the north direction closely below range 40. There is the formation of a bullish candlestick promising resurfacing of more ups as against the return of downsides at that present trading level.
Will the BCH/USD price continue with the current shows recovery move?
The US Dollar has relaxed its forces being overtime in the recent past sessions inflicted upon the market valuation of Bitcoin Cash. As the base trading instrument now shows a recovery move as placed with the counter-fiat tool, the crypto appears to have come by strong support around the value of $500. Therefore, a slight downward move attempted toward that point could mean to eventually allow a stronger price upswing.
Now two price lines need to be placed on a watchful list as regards the continuation of downsides in this crypto market. And, they are $800 and $1,000 values. Bears are now at the first line area to launch strong resistance against the crypto’s price to be able to push back the market into a downward movement once again. If that is not achieved in the long run, the higher level could potentially give bears a better chance to regain the market’s control.
BCH/BTC Price Analysis
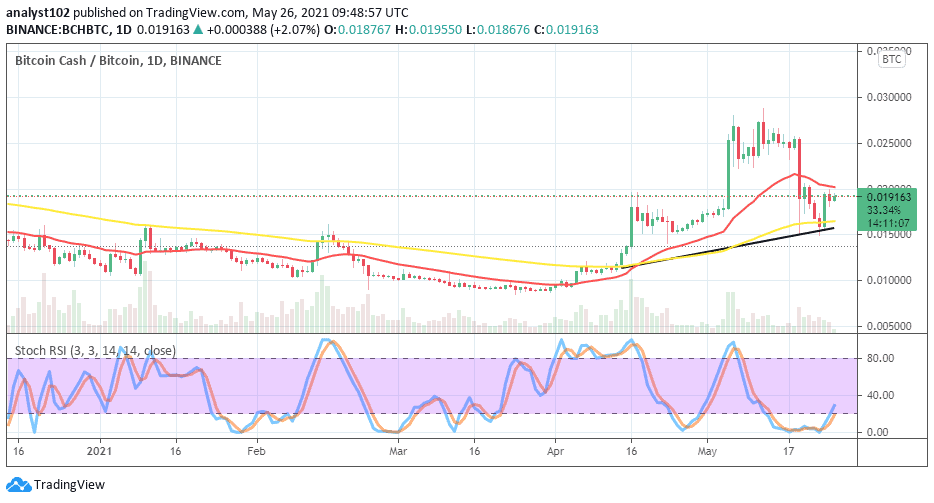
On the BCH/BTC daily price chart, the trading situation now shows a recovery move already embarked upon by the base instrument as compared with the countering tool. Lately, Bitcoin Cash fell notably in a correctional downward move as paired with the flagship Bitcoin. The bullish trend-line drew closely along with the 50-day SMA indicator to showcase the support level where recovery moving mood has kicked off. The 14-day SMA trend-line is located above them. The Stochastic Oscillators have crossed the hairs towards the north a bit past range 20. That suggests that the base instrument will most likely go to increase its domineering presence in the market as placed with the counter tool.
Remember, all trading carries risk. Past performance is no guarantee of future results.
Credit: Source link


