Bitcoin Price Prediction – March 20
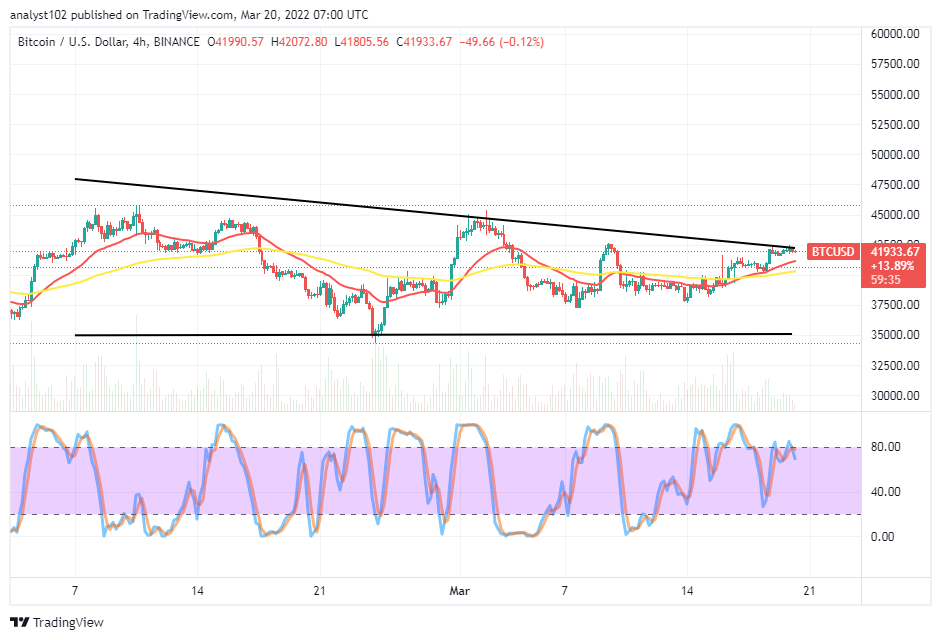
The BTC/USD market activities went down after moving in the range-bound zones of $45,000 and $40,000. The crypto trade eventually found support around $37,500 which has been the baseline of a rallying motion. Presently, the crypto-economic price pushes high to face resistance at $42,500 as it trades around $41,933 at a minimal negative percentage of 0.12.
BTC/USD Market
Key Levels:
Resistance levels: $45,000, $47,500, $50,000
Support levels: $40,000, $37,500, $35,000
BTC/USD – Daily Chart
The BTC/USD daily chart reveals the crypto-economic price pushers higher, facing resistance at $42,500. The candlestick currently in the making appears not getting energy to upkeep the subsequent moves to the upside. Price finds breaking out past the bigger SMA trend line difficult around the value-line. The 14-day SMA indicator is underneath the 50-day SMA indicator. The descending triangular pattern almost breaks out at the upper end. The Stochastic Oscillators are in the overbought region, seemingly attempting to close their lines within it. That suggests an end is imminent as regards the north side.
Will the BTC/USD market break past the $42,500 level as the crypto-economic price pushes high, facing resistance at $42,500?
The BTC/USD market is at the verge of breaking past the $42,500 level as the crypto-economic price pushes high to now face resistance around the value-line. A sudden sustainable shoot out at the point will put the market running toward a higher resistance at $45,000 for a test possibly at the first touch of it. In negation to that assumption, it appears that that scenario will play out in the near time.
On the downside of the technical analysis, because the market is still in its bearish trading cycle, the point at $42,500 could be the actual spot to get a decent re-approach of sell entries if price cannot push for holding above the point. Even at that, the BTC/USD market short-position placers have to be on the lookout for a quick correctional move while that a volatility plays out to the upside toward or around the $45,000.
BTC/USD 4-hour Chart
The BTC/USD medium-term chart showcases the crypto-economic price pushes high to reach resistance at $42,500 after a long line of featuring a rallying motion. The 14-day SMA indicator has intercepted the 50-day SMA indicator from beneath, within the descending triangular pattern drawn, touching the value-line mentioned earlier as the top and the $35,000 level as the critical support baseline. The Stochastic Oscillators have been somewhat consolidating around the range of 80. That indicates the northward pushes may, in the near time, come to an end
Looking to buy or trade Bitcoin (BTC) now? Invest at eToro!

68% of retail investor accounts lose money when trading CFDs with this provider.
Read more:
Credit: Source link


