Bitcoin Price Prediction – June 28
The trading activity between Bitcoin and the USD fiat currency now slightly gaps northbound to trade around the value of $34,458 at a positive percentage rate of about 5.25.
BTC/USD Market
Key Levels:
Resistance levels: $37,500, $42,500, $47,500
Support levels: $30,000, $27,500, $25,000
The BTC/USD daily chart currently depicts that the crypto’s worth gaps northbound away from a lower point above the support level of $30,000. The market presently averages $35,000, where both the smaller SMA trend-line and the bearish trend-line are southwardly underneath the 50-day SMA indicator. The Stochastic Oscillators have crossed the lines to the north slightly against range 40 to signify that a buy pressure is somewhat ongoing.
Could there be a reliable upward move as the market now slightly gaps northbound?
What has technically established regarding the BTC/USD trading operation is that the point of $30,000 may have continually been the most reliable zone for buy entries. Now that the market slightly gaps northbound from around the value, bulls could count upon making an instant execution order to build upon the sudden slight gapping motion.
Countering the beefing upon the current northbound gap moves bears needed to reposition their stance in the crypto market around the levels of $35,000 and $37,500. A further aggressive breakout of those values will potentially put the trade on the path of recovery once again. But, in the long run, the market trading zone of around the level of $40,000 may difficult for a smooth further breakout to the north.
BTC/USD 4-hour Chart
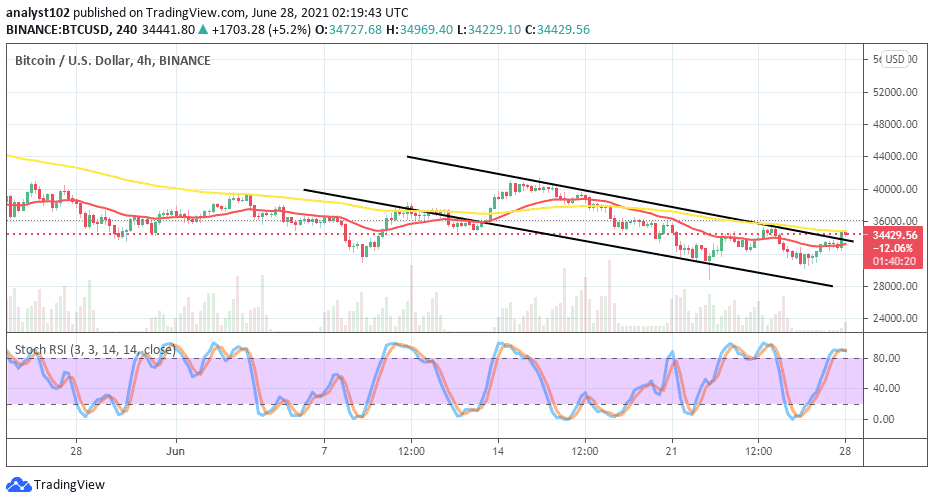
There is a slight northbound push against the upper bearish channel trend-line on the BTC/USD 4-hour chart. The medium-term trend still looks bearish as the market capacity to move further to the north seems to get a reduction as suggested by the Stochastic Oscillators that have moved into the overbought region. The 50-day SMA indicator is above the 14-day SMA trend-line as the upper bearish channel trend-line drew between them to the south. The Stochastic Oscillators have closed the lines in the overbought region. Only a consolidation moving of them could signify further upswings of the crypto market.
Looking to buy or trade Bitcoin (BTC) now? Invest at eToro!
75% of retail investor accounts lose money when trading CFDs with this provide
Credit: Source link


