Another key metric is flashing a Bitcoin buy signal. That’s according to a tweet by popular crypto analyst/influencer Mohit Sorout. According to Sorout, the so-called DCA Indicator, which he called “the mother of all BTC bullish signals” has flashed for only the fourth time ever.
DCA stands for dollar cost average, a technique used by cryptocurrency investors where they buy a set amount each day in order to secure a favorable average price. Expanding further on the exact parameters of his indicator, Sorout explains that the “daily DCA indicator tracks the profit/loss of buyers who hypothetically bought a fixed $ amount worth bitcoin daily for the past year (365 days)”.
Bitcoin Market Has Returned to Profitability – Bullish Sign?
The bullish sign from the DCA indicator is another sign that Bitcoin’s price rally since the start of the year has propelled the market back into profitability. That’s important because analysts view a return to Bitcoin market profitability following a prolonged bear market and period where much of the market was at a paper loss as a lead indicator of an incoming bull market.
The signal from the DCA Indicator chimes well with two widely followed indicators tracked by crypto analytics firm Glassnode. The 30-Day Simple Moving Average (SMA) of the Bitcoin Realized Profit-Loss Ratio (RPLR) indicator moved above one for the first time last April at the beginning of the month. That means that the Bitcoin market is realizing a greater proportion of profits (denominated in USD) than losses on BTC sales (or, when each BTC moves).
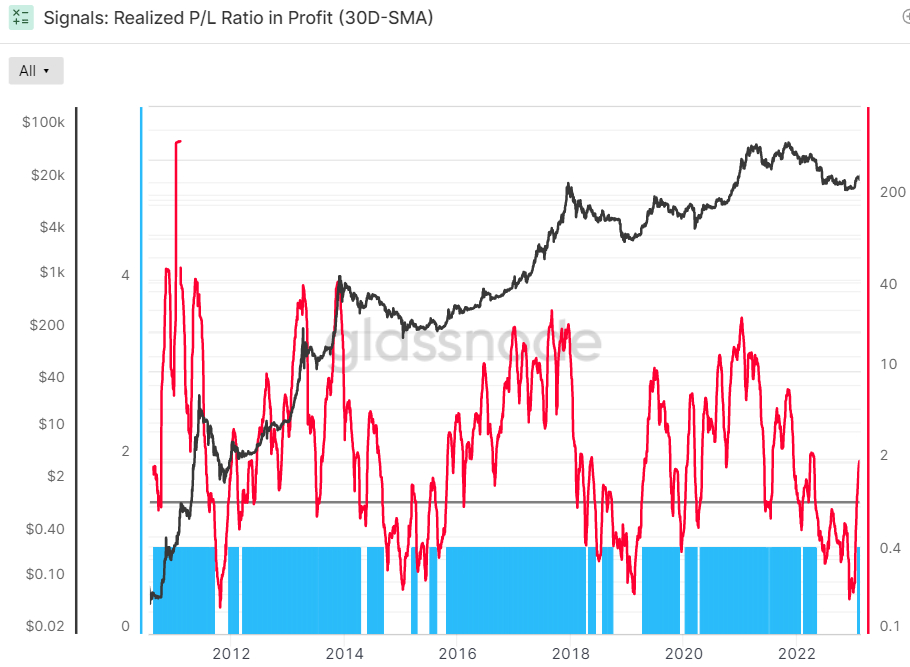
According to Glassnode, “this generally signifies that sellers with unrealized losses have been exhausted, and a healthier inflow of demand exists to absorb profit taking”. Hence, this indicator is sending a bullish sign. Historically, the 30-day SMA of the Bitcoin RPLR moving back above 1 after a prolonged spell below (like in November 2015 and April 2019) proceeds a savage rally in the BTC price.
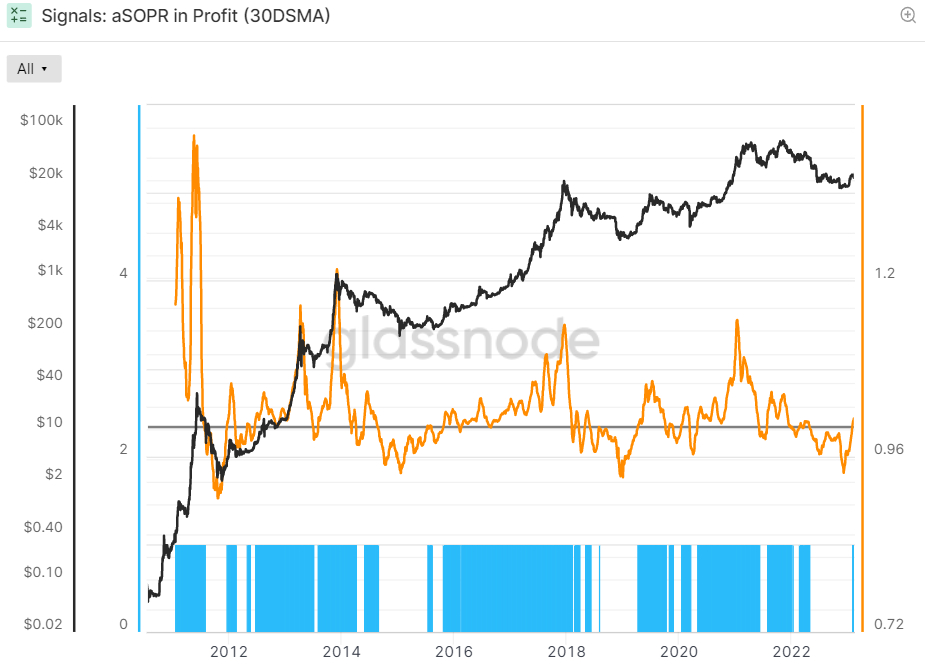
Similarly, the Adjusted Spent Output Profit Ration (aSOPR), an indicator that reflects the degree of realized profit and loss for all coins moved on-chain, recently surpassed 1, indicating the market is in profit. Looking back over the last eight years of Bitcoin history, the aSOPR rising above 1 after a prolonged spell below it has been a fantastic buy signal.
Elsewhere, another market profitability indicator tracked by CryptoQuant, another crypto analytics firm, is giving off a definitive buy signal for the first time since 2019.
Add the DCA Indicator to a Laundry List of Bullish Signals
The DCA Indicator is the latest in a growing laundry list of popular on-chain and technical metrics to flash a bullish signal. The above two Glassnode indicators are used by the cryptocurrency firm in their popular “Recovering from a Bitcoin Bear” dashboard, which the crypto firm’s analysts utilize to gauge whether Bitcoin might be in the process of transitioning from a bear market into a longer-term bull market.
The dashboard tracks eight indicators to ascertain whether Bitcoin is trading above key pricing models, whether or not network utilization momentum is increasing, whether market profitability is returning and whether the balance of USD-denominated Bitcoin wealth is in favor of the long-term HODLers. As discussed in a recent article, seven out of eight of these indicators are currently flashing green and the final eighth one might soon also send a bullish signal.
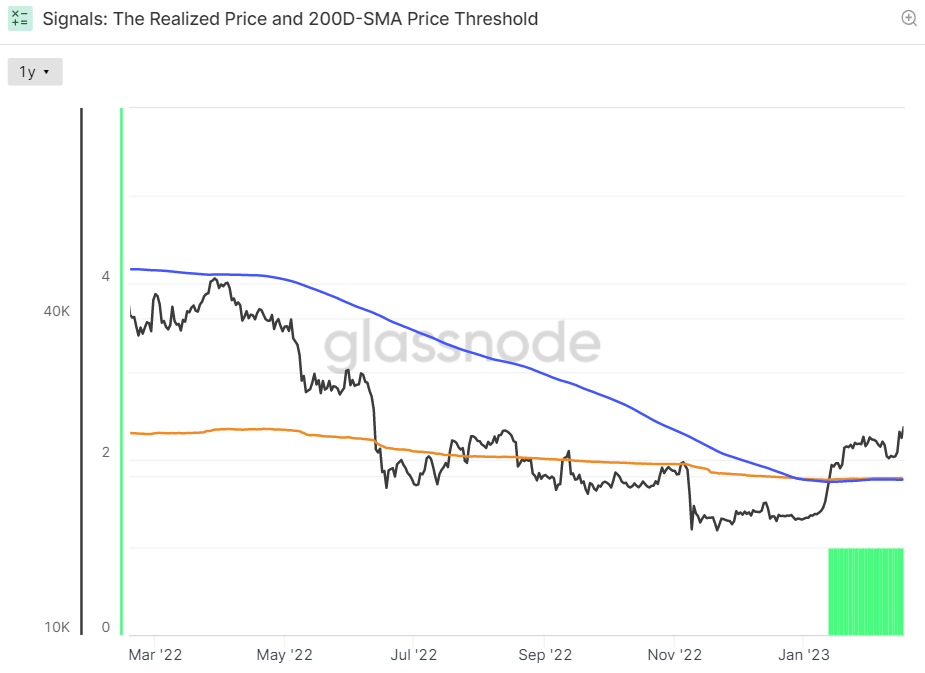
Regarding where Bitcoin is trading versus key pricing models, BTC this year surged above its 200-Day Moving Average and Realized Price, both of which sit just under $20,000, a dual bullish sign on the technical front. Another recent technical buy signal that got the bulls excited was Bitcoin experiencing only its seventh “gold cross” in the last 10 years. Elsewhere, the number Bitcoin wallet addresses holding a non-zero balance recently surged to a new all-time high, a sign that new investors are flooding in.
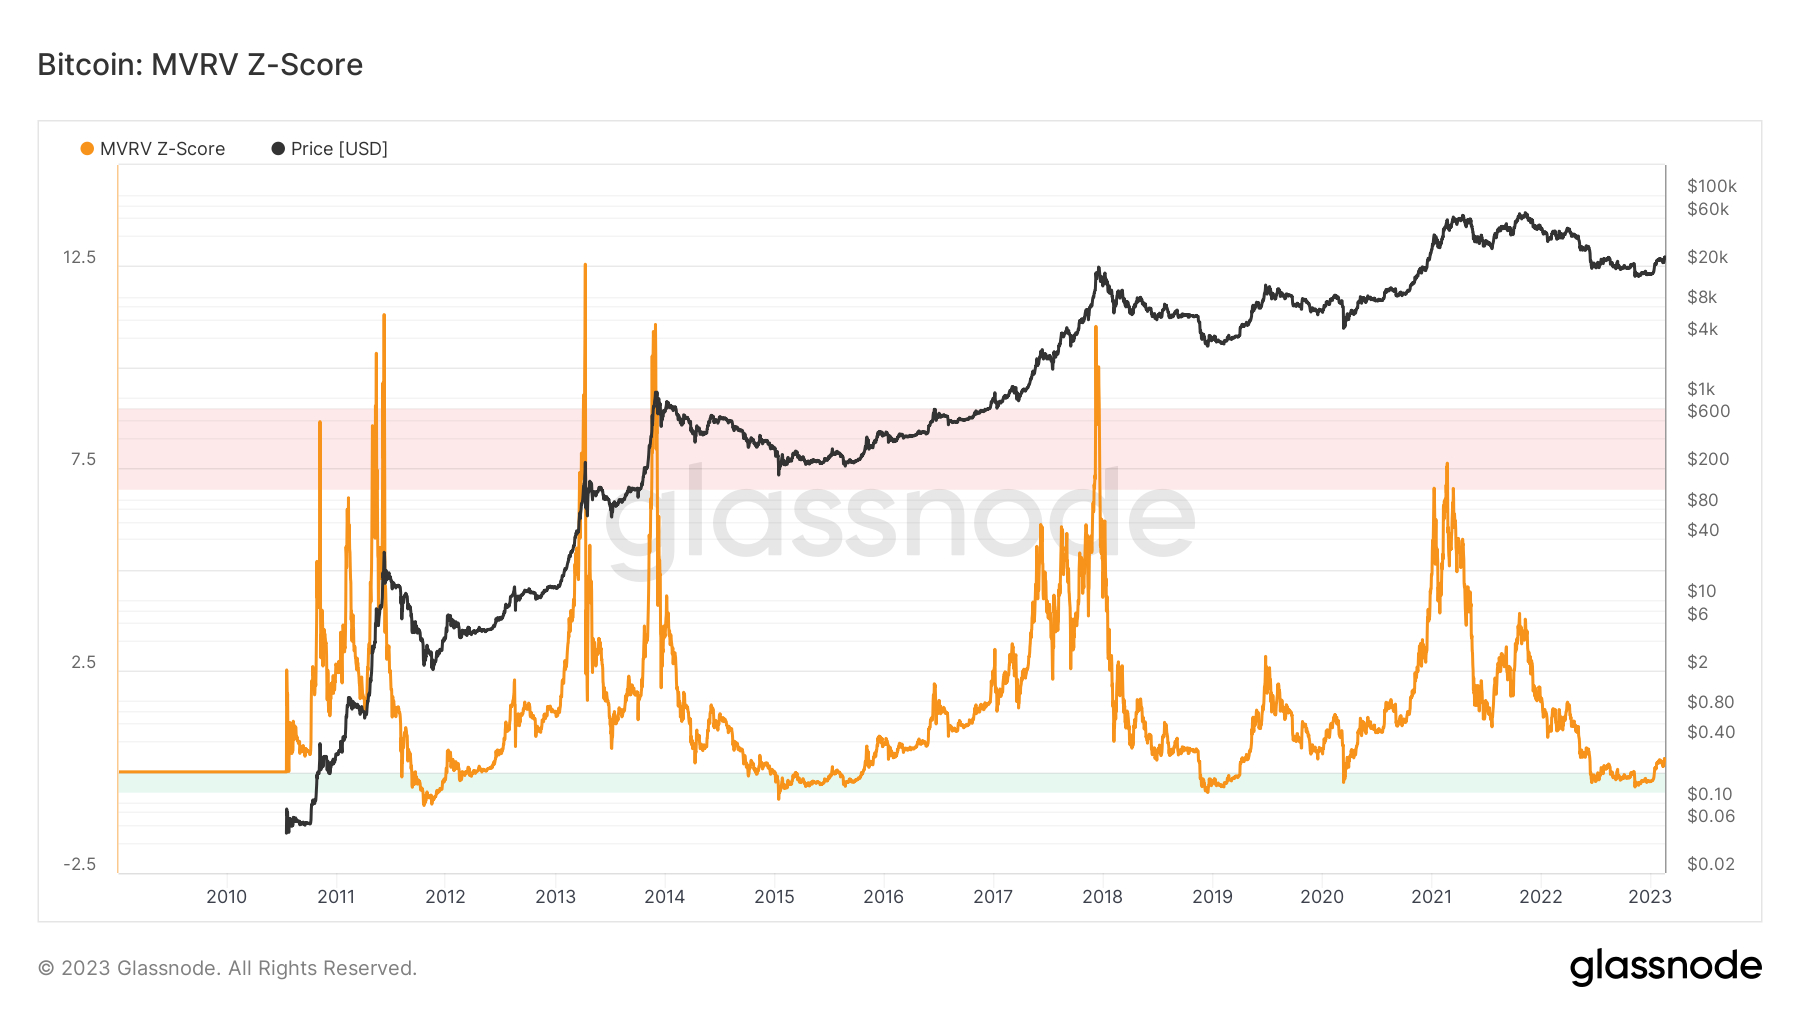
Other on-chain indicators tracked by Glassnode like Bitcoin’s Reserve Risk, as discussed in this recent article, a the MVRV-Z score, which “compares market value and realized value to assess when an asset is overvalued or undervalued”, are also screaming bull signals. The latter recently mustered a sustained recovery back above zero after a prolonged period below, which has historically occurred at the start of bull markets.
Meanwhile, bulls are also taking solace from analysis of the market cycles that the world’s largest cryptocurrency by market capitalization has historically followed. In early January, crypto-focused Twitter account @CryptoHornHairs identified that Bitcoin is following nearly exactly in the path of a roughly four-year market cycle that has been respected perfectly now for over eight years.
Elsewhere, a widely followed Bitcoin pricing model is sending a similar story. According to the Bitcoin Stock-to-Flow pricing model, the Bitcoin market cycle is roughly four years, with prices typically bottoming somewhere close to the middle of the four-year gap between “halvings” – the Bitcoin halving is a four-yearly phenomenon where the mining reward gets halved, thus slowing the Bitcoin inflation rate. Past price history suggests that Bitcoin’s next big surge will come after the next halving in 2024.
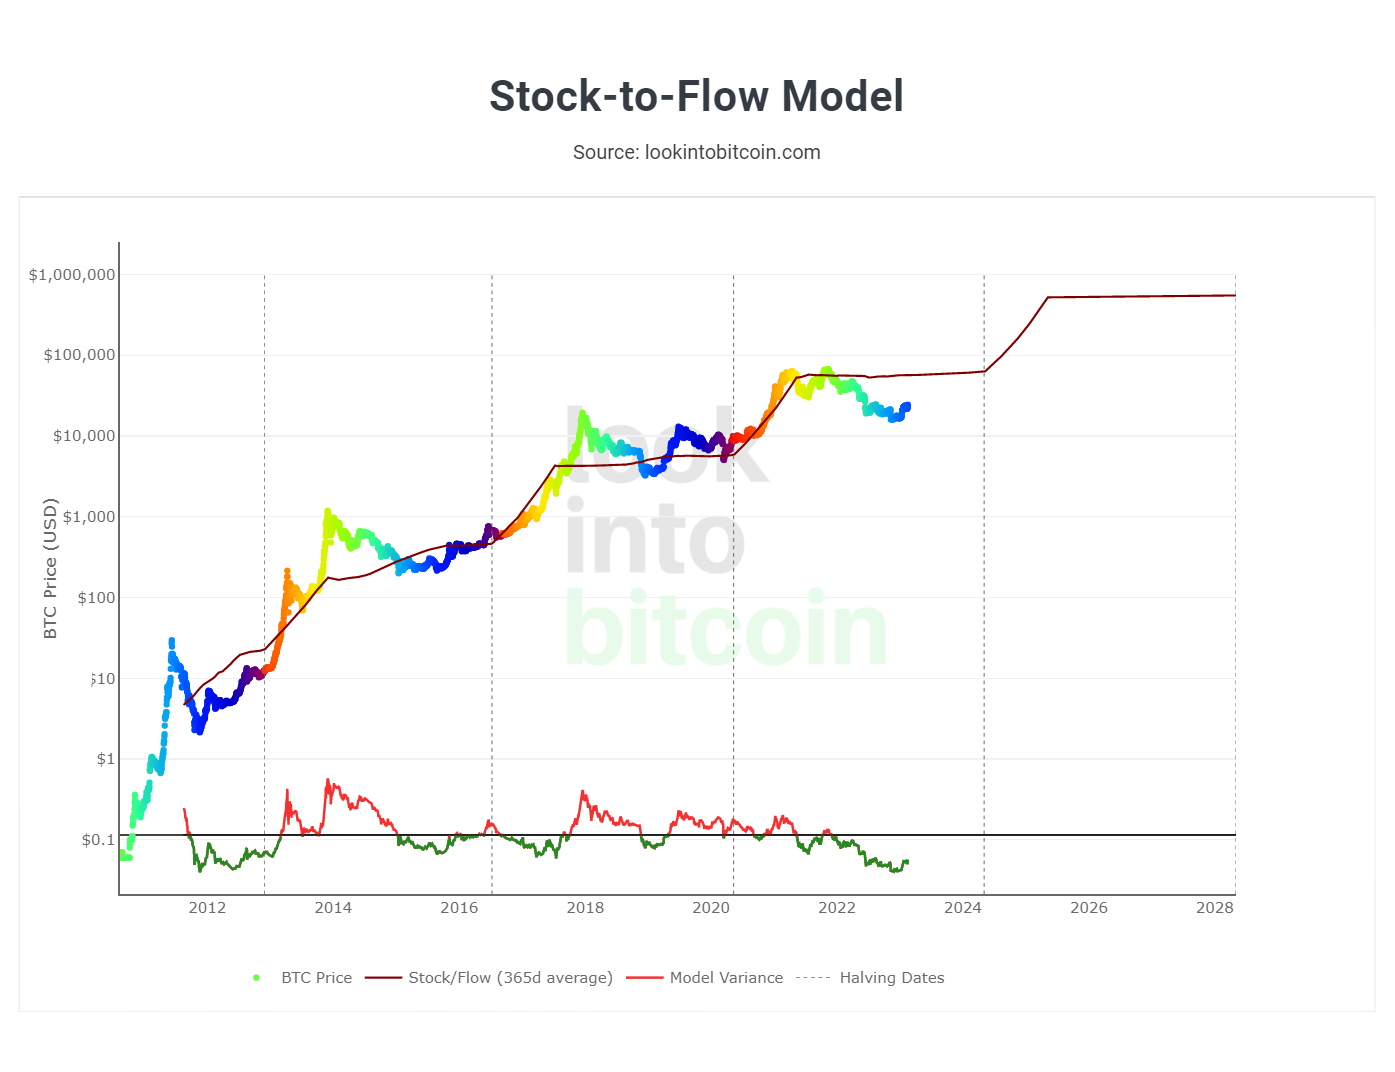
Given all of the above, perhaps it should come as no surprise that Bitcoin continues to defy macro headwinds, such as the recent move higher in the US dollar and US bond yields driven by a build-up of Fed tightening expectations in wake of recent hawkish communications from policymakers following this month’s string of super strong tier one US data releases.
Credit: Source link


