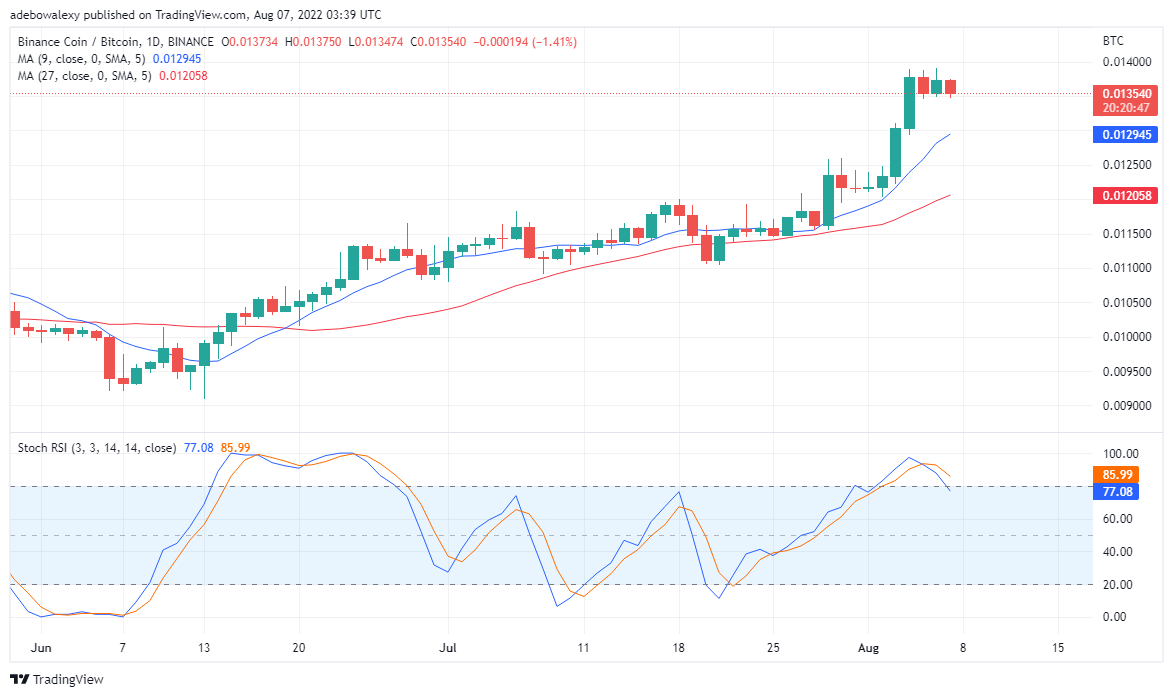
Binance coin has had a nice time on the upside for a significant amount of time. Frankly, BNB has displayed an impressive performance, rallying from the 11th of last month till now. It could be seen that even each time the trend tries to reverse, it eventually finds higher support than the previous and move from there.
Binance Coin Forecast Statistics Data:
Binance Coin’s current price: $311.4
Binance Coin market cap: $17.92 billion
Binance Coin circulating supply: 17.92 billion
Binance Coin total supply: 17.92 billion
Binance Coin Coinmarketcap ranking: #7
Key Marks:
Resistance levels: $293, $300, $318
Support levels: $311.4, $295, $285
Perhaps this could be a ray of hope for this crypto now even as it trying to reverse. Nevertheless, in this forecast, we shall critically consider this market to see what we can anticipate as the new trend is developing. We shall both consider Binance against the US dollar and Bitcoin.

Binance Coin Value Forecast: BNB Starts a New Trend
The BNB/USD portrays that a new trend has begun in this market. The appearance of an inverted bearish hammer candlesticks signals this, and this is followed by another bearish candle. Technically speaking this predicts a downtrend. However, we can see that the 9/27-days Moving Average (MA) lines are still significantly under the price movements. This brings some hope into this market, this is because the downward trend can still reverse near the MAs.
Also, going by previous performance and the behavior of the MA lines, this downtrend may just finding higher support. Nevertheless, this will be the best-case scenario, otherwise, the downtrend may take the price lower than the previous one. Therefore, traders who bought the crypto earlier may place a sell limit near $280 the previous support.

Binance Coin Value Forecast: BNB Downward Correction Stays Intact
Furthermore, the BNB/BTC developing downtrend extends here as well. Like what we have in the BNB/USD market, we can see that the MAs are significantly below the price movements. However, there are signs that the downward trend here is stronger than the one in the previous market. This sign is coming from the Stochastic RSI indicator. One can see the threads of this Indicator now plunging downwards, after reaching the over-bought region.
In addition, a significant rise in the value of Bitcoin will steeply plunge the value of the BNB/BTC. Therefore, apart from keeping an eye on the BNB/USD market, traders should also monitor the activities in the Bitcoin market. However, long-term traders of this pair should take a profit near $0.012500. So if the trend doesn’t reverse before hitting $0.012500 it is advisable to exit the market.
Tamadoge – Play to Earn Meme Coin
- Earn TAMA in Battles With Doge Pets
- Capped Supply of 2 Bn, Token Burn
- NFT-Based Metaverse Game
- Presale Live Now – tamadoge.io
Credit: Source link


